Counting a Diverse Nation — Disaggregating Racial/Ethnic Data to Advance Health Equity

How we measure America's rapidly expanding diversity has critical implications for the health of the nation. Too often, the data used to drive policymaking, allocate resources, and combat health disparities is based on broad racial and ethnic categories that can render the unique needs, strengths, and life experiences of many communities invisible.

That is why PolicyLink is excited to release Counting a Diverse Nation: Disaggregating Data on Race and Ethnicity to Advance a Culture of Health, a multifaceted investigation that explores the leading issues and opportunities of racial/ethnic data disaggregation, and its implications for advancing health equity. The report provides a comprehensive assessment of racial and ethnic data disaggregation practices today, and concrete recommendations for improving research methods and promoting government policies that enhance and enable data disaggregation in the future.

READ THE FULL REPORT AND RELATED MATERIALS

Findings and recommendations in the report encompass two areas:

  • Best practices for collecting and analyzing data about race and ethnicity at more detailed levels, including research innovations and special considerations for studying marginalized populations;
  • Government policies and practices that can enhance and enable data disaggregation, including recent campaigns and policy wins across the nation that are supporting increased representation across racial, ethnic, and cultural identities.

Developed as part of a multiphase project commissioned by the Robert Wood Johnson Foundation, the report reflects two years of collaborative research and input among a diverse set of experts, demographers, practitioners, decision makers, and advocates. Reviews by these researchers of the state of data disaggregation for each major U.S. population group, along with a comparative study of seven other countries, accompany the new report

To learn more about the critical importance of disaggregating racial/ethnic data from researchers, advocates, and other experts who contributed to this report, listen to the archived webinar.

    Take Action: Oppose the Citizenship Question on the 2020 Census

    The question about citizenship proposed for the 2020 Census by Commerce Secretary Wilbur Ross would create enormous problems and result in a systematic undercount in lower income communities of color that would significantly undercut fair political representation, allocation of federal funds, and our basic understanding of who lives in the United States.

    Electoral districts for all Congressional, state, and local offices would be biased for a decade, and the needs and eligibility of key population groups for federal resources would be underestimated, at a point when major demographic changes are underway across the country. Recent evidence has shown that the plan for the citizenship question was not an earnest effort to help enforce the voting rights but just the opposite: a deliberate strategy to politicize and undermine the accuracy of the Census. The lawsuits brought by human rights and civil right advocates and state governments are an important defense against the citizenship question, but the government also needs to hear from all of us!

    The Commerce Department is taking public comments through August 7, and the Census Counts campaign has created an online portal through which everyone can easily submit their views. Please take a moment today to join PolicyLink and hundreds of other organizations in defense of a fair Census that counts everyone. For further information, see PolicyLink Vice President Victor Rubin’s blog post, which includes many useful resources.

    There’s No Need for A Citizenship Question in the Next Census

    The announcement by U.S. Secretary of Commerce Wilbur Ross that the 2020 Census will agree to the Justice Department’s request and add a question about citizenship is wrong on so many levels that it’s hard to track them all.  The Constitutionally-mandated responsibility of the decennial census is to count all residents, regardless of citizenship, and actions that would interfere with doing that as thoroughly as possible undercut that grave responsibility. 

    A question about citizenship would discourage participation in the Census and lead to systematic undercounting of residents and an incomplete, biased picture of who lives in the United States. The consequences of such an undercount would be dire, skewing political representation and the allocation of federal funds. The undercount would affect immigrant communities of color in particular. For example, as the First Focus Campaign for Children put it, “For Hispanic children, the problem of being undercounted is exacerbated by a recent decision from the Department of Commerce to add a question on citizenship in the 2020 census. Coupling this announcement with aggressive and cruel immigration enforcement tactics currently being undertaken by the Trump administration, the expectation becomes a dramatically reduced participation rate from immigrant and mixed status families who fear the negative repercussions of revealing their immigration status.”

    Advocates for an accurate, complete, and fair Census are used to raising their voices to push for more resources to be devoted to outreach, not to warding off bad, inflammatory proposals. But in reacting swiftly to this misguided and cynical step, they have the facts, the Constitution, and the nonpartisan importance of unbiased data on their side. There is no need for a citizenship question in the decadal Census to enforce the Voting Rights Act, as the Justice Department has claimed. There is great risk in adding an untested question at this late stage, jeopardizing years of preparation. We support the lawsuits being filed by several states and other parties and the movement to push Congress to reverse this plan. 

    For further information about these efforts, see the following sources:


    Advancing Economic Inclusion in Southern Cities


    In 2015, the Annie E. Casey Foundation, in partnership with PolicyLink, launched Southern Cities for Economic Inclusion, a cohort of seven cities dedicated to advancing economic equity for low-income communities and communities of color. Comprised of city officials and staff, local philanthropy, and business and community partners from Atlanta, Asheville, Charlotte, Memphis, Nashville, New Orleans and Richmond, the group convenes regularly to share best practices and learn from experts. Their next meeting will be in Richmond from October 23-25.

    This group explicitly identifies and addresses the unique historical, political, and legal obstacles to achieving economic inclusion in the South; namely, the region’s deeply entrenched legacy of racism and segregation, as well as the structural limitations imposed by state laws that strip cities of the authority to advance economic inclusion policies such as local hiring or inclusive procurement.

    Leaders from the seven cities are advancing real solutions by:

    • Establishing an economic agenda that both acknowledges and confronts the legacy of race. City and community leaders in New Orleans and Atlanta have created economic opportunity plans that set a proactive agenda to invest in people of color and others who have been left behind and demonstrate how equity will lead to everyone being better off.  
       
    • Bringing together diverse stakeholders to advance an economic inclusion agenda. In Memphis, Nashville, and elsewhere, anchor institutions such as universities and medical facilities, along with business and other leaders in the private sector, are coming together with city partners to encourage growth in the minority business community and bring new investments into communities without causing displacement. 
       
    • Innovating policies and programs to support minority-owned businesses and connect people to jobs. In Charlotte, Richmond, and Asheville, cities have developed pilot procurement programs and incentives to support minority businesses and to help connect individuals with barriers to employment to good jobs.
       

    These projects and initiatives are changing the cultural silence on race in economic development policy and strengthening local positions despite state restrictions on local authority. We applaud these city leaders for their work thus far.  Reaching this point has required creativity in policy design, political deftness, and most of all, resilience.  However, advancing this work will require additional investment and strong partnerships across a wide range of stakeholders, including local and national philanthropy, the private sector, and community-based organizations. We hope you will join us to advance an economically inclusive and prosperous South.

    We Are All Dreamers

    Turning our backs on young Americans who arrived in this country with family or other adults seeking a better life is morally reprehensible. The Trump Administration’s decision to eliminate the Deferred Action for Childhood Arrivals (DACA) program places over 800,000 young people at risk of deportation and separation from their loved ones and reneges on a promise made to those young people by our government.

    Yesterday’s action underscores the Administration's pursuit of normalizing racist and xenophobic beliefs through an agenda rooted in the criminalization of people of color. Igniting polarization by race and ethnicity and scapegoating our immigrant brothers and sisters threatens the culture, economy, and security of our nation. Again, we must stand up for the latest target of this hate-filled Administration whose efforts to splinter the nation for the benefit of a cruel minority have no end. We are all DACA children.  

    Ending DACA is morally wrong and economically foolish.  For years, PolicyLink has argued that Equity is a moral imperative and the Superior Growth Model.  The diversity of this country is critical to its economic growth and prosperity.  The actions against DACA will negatively impact the economy in ways underscored by recent studies revealing a loss of billions from the national GDP over the next decade and the loss of contributions from thousands of valuable workers and entrepreneurs.   

    Young people covered by the DACA program must be protected and the nation’s promise honored.  Now more than ever, we need Congress to act quickly and confirm that Americans of every race and creed are valued, that our government keeps its promises and rejects hate and xenophobia, and that the U.S. is a place that welcomes all who come sharing a democratic vision and valuing freedom, justice, and equity for all.   

    Here are a few things you can do to demonstrate your support:  

    1. Call your members of Congress and demand their support for the Dream Act. And, with DACA ending, it's time for Congress to pass a clean version of the bipartisan Dream Act. Use dreamacttoolkit.org to call and urge your member of Congress to stand up for Dreamers.  
    2. Attend a rally: You can locate rallies in your area using Resistance Near Me.   
    3. Show your support online: Raise your voice to support the #DreamAct by tweeting and posting your support for young immigrants. Make it clear that they are #HereToStay. Find sample tweets & hashtags below.

    Sample Tweets:

    • Trump decision on #DACA is morally wrong & economically unwise. Congress must stand up 4 young immigrants & America. Protect immigrants now!
       
    • Will Congress pass the Dream Act, which creates a path to citizenship for Dreamers, without using their loved ones as bargaining chips? 1/2
    • Or will they stand idly by and let the president destroy the lives and livelihoods of immigrants? #HeretoStay 2/2
       
    • 800,000+ dreamers are in our workforce. Ending DACA not only disrupts their lives but also their employers, coworkers, patients & more.
       
    • Trump's decision against Dreamers is not the end for immigrants. Congress must do right by them: pass the Dream Act. #HeretoStay
       
    • @HouseGOP @SenateGOP have a choice: side w/ 800,000+ young immigrants and protect them... or uphold Trump's hate agenda? #HeretoStay
       
    • @realDonaldTrump has stripped legal status of young immigrants who make America strong. Congress must right this wrong: pass #DreamAct!
       

    White People, Show Us

    Over the past several days we have watched in disgust as the progeny from our nation’s despicable past terrorized a city, committed murder, and received tacit approval from the highest level of government. White supremacy has found a home in the White House. The President is determined to perpetuate and maintain the social, political, historical, and institutional domination by White people at the expense of people of color. And in so doing, he is creating an environment that is also too toxic for White America. The White supremacy movement will not vanish until people of good will succeed in atoning for our nation’s past, reconciling, and building a bridge to a just and fair society where ALL are prospering and reaching their full potential.

    America is seeing in real-time what the fight for equity looks like. When cultures, structures, and institutions are forced to change, the responses by those comfortable with and benefiting from the status quo are too frequently ugly, distressing, and violent. Equity leaders should not expect anything less. We signed up for this. Consequently, when things are at their worst, we must be at our best – body, mind, and soul. PolicyLink remains optimistic and single-minded in our work. We are standing strong in the face of formidable opposition because equity leaders, especially those on the front lines, are making progress.

    We also are standing strong because we are getting a sense that increasing numbers of White people are sick of other White people's racist conduct. We applaud the fact that from the streets, to corporate board rooms, to charitable giving, White people are taking up the work of equity. We hope we live in a country where most White people do not sympathize with White supremacists. If our perceptions are real, we have an opportunity to accelerate the advancement of equity, and we must seize it. While people of color are going to see this fight for equity through to victory, there is a powerful role that White people must play, and this role can no longer be eschewed for safer, transactional expressions of solidarity.

    Show yourselves to be true patriots by joining with people of color, believing in the potency of inclusion, and building from a common bond to stamp out White supremacy and realize the transformative promise of equity – the imperfect and unrealized aspiration embodied in the Constitution. White America, you can perfect this aspiration! To do so requires that you honestly and forthrightly call out racism and oppression, both overt and systemic. And while this is a good start, it is insufficient. Your work is to lead the way in designing and implementing equity-centered public policies, institutional practices, cultural representations, and other norms that trump White supremacy and create a just and fair society. This must be your call to action. This is what people of color need from you.

    The normalization of White supremacy must be stopped now before it irreversibly poisons the nation’s culture. Your leadership is critical in this moment. You are best equipped to defeat White supremacy. Here are actions you can take that are transformative.


    Show us that our perceptions of a White majority opposed to White supremacy are real. Show us that we have a reason to believe that you will fight with more devotion to create a society that is just and fair for ALL, than White supremacists will in their pursuit to maintain their structural advantage, their racial privilege, their "whiteness." By accepting this invitation, you’re not doing anyone any favors. You’re doing the work necessary to make America all that it can be. History has its eyes on you. Show us. Fight for equity.

    With gratitude,

    Angela Glover Blackwell
    CEO  

    Michael McAfee
    President

    PolicyLink Applauds Court’s Refusal to Reinstate Ban

    The 9th Circuit, affirming the Court's right to review the president's action, refused to reinstate the Administration’s travel ban, thus upholding the nation's commitment to just and fair inclusion, at least for now.  Where you come from, where you live, and how—or if—you worship, may not be a basis for exclusion from the country without due process. Anything less, “runs contrary to the fundamental structure of our constitutional democracy.”

    Today’s win is a small victory in a battle of immense proportions. Savor small victories, even as we gird ourselves for the next fight.

    All-In Cities Update: December 12, 2016

    In the aftermath of November 8, it is clearer than ever that cities and the counties and metropolitan regions in which they are situated are the crucibles where an inclusive American economy and democracy can and must be forged. From Atlanta to Indianapolis, cities across the country passed ballot measures designed to expand opportunity and dismantle barriers to inclusion. In our hometown of Oakland, the anti-displacement and equitable infrastructure measures we supported won handily. As the All-In Cities team plans for the year ahead, we are look forward to continuing to help local leaders ensure that the cities they love are places where all can thrive and participate in building the next economy. 
     
    Building Community Power in the Age of Trump
    Following the election, associate director Tracey Ross wrote a piece for Rooflines, the Shelterforce blog, critiquing post-election narratives. She explains, “As the media and national figures continue to tell a story that overlooks how the concerns of people of color may have impacted the election, local leaders must be working to ensure workers of color are empowered to tell their own story.” Check out the full piece here.  
     
    Buffalo: Health Equity and Inclusive Growth Profile Launched
    With support from the Robert Wood Johnson Foundation, PolicyLink has partnered with Open Buffalo, a community coalition focused on justice and equity in the city of Buffalo, to produce a comprehensive equity profile that can inform policy solutions for health equity, inclusive growth, and a culture of health in the “Queen City.” We kicked off the engagement with a site visit on December 1 that included tours of West Buffalo and the historic Fruit Belt neighborhoods, interviews with community and city leaders, and a review of the initial data. We will be releasing the report and policy agenda in March 2017. 
     
    Pittsburgh: Next City Highlights Equitable Development Momentum
    Next City covered the progress that has been made since the release of Equitable Development: The Path to an All-In Pittsburgh in September. Senior director Sarah Treuhaft discusses the growing momentum among community leaders. “When we started working there, there was definitely not that sense that change was possible,” she explained. “By next year we want to see more of that, and create a sense that change is happening — that it’s not just possible but it’s actually happening and progress is being gained.” You can read the whole article here.
     
    New Equitable Growth Data for Cities
    The National Equity Atlas, produced in partnership with the USC Program for Environmental and Regional Equity (PERE), continues to expand to meet the data needs of those working to advance equitable growth in cities and metros. In October we added new neighborhood-level maps for four indicators, including unemployment and disconnected youth. And in November we updated 17 of our 32 indicators to 2014 five-year pooled data (it was previously the 2012 five-year pooled data).

    Learn more about our All-In Cities initiative and sign up for updates at www.allincities.org.

    buildings-houses

    Introducing New Neighborhood Opportunity Maps


    We know that opportunity differs by neighborhood, and maps are one way to visualize this variation across a given city, region, or state. That’s why today, we are adding mapping breakdowns to the following four indicators on the National Equity Atlas:


    These new interactive maps allow you to visualize data by county or by census tract as well as by city, region, or state. You can also toggle back and forth between different years to see how the geography of opportunity has changed over time and create custom maps using an interactive filter and scroller. On the race/ethnicity map, for example, the scroller allows you to visualize measures of opportunity (e.g. homeownership) in relation to neighborhood composition (e.g. the share of the Latino population). And on the disconnected youth and unemployment maps, the scroller allows you to visualize the indicator as neighborhood compositions (e.g. share of the Black or Native American population) vary.

    This blog walks you through how to access and use the new maps. Register for our 30-minute webinar on November 2 for a live walk through.

    How to find the new maps

    To access the new maps for the people of color indicator, click on the Indicators tab in the top navigation bar. Then under the Demographics menu, select “People of color.” You can look at the data by county (the default), by the largest 150 regions, or by state. You can also toggle back and forth between every decade from 1980 to 2040 to see how the share of people of color in the U.S. has changed over time. The GIF below pulls from the new maps to show how the share of people of color has changed from 1980 to 2010 and how it is projected to change by 2040. You can also see the new people of color map on the homepage of the Atlas.
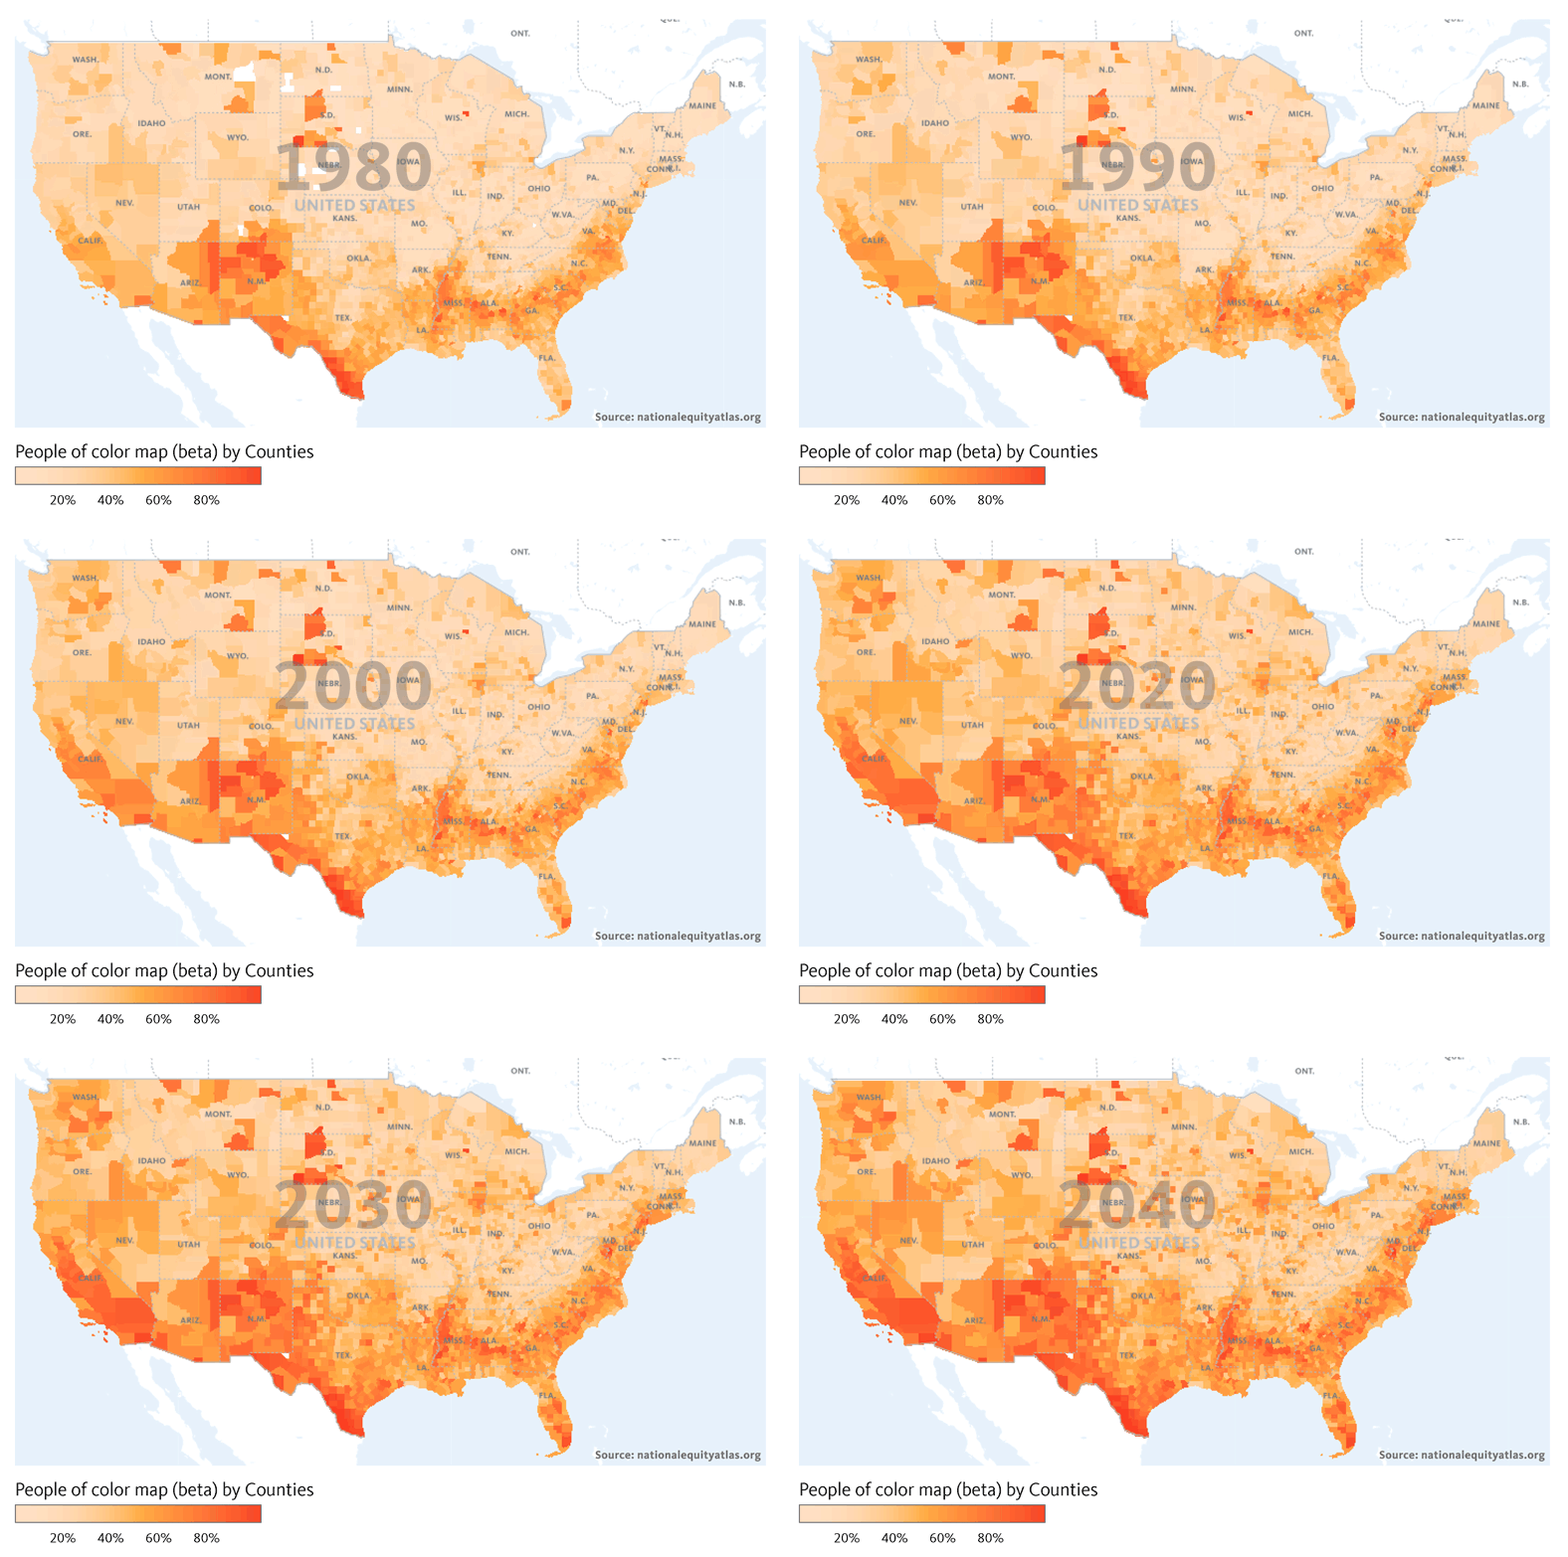
    You can filter by White areas, Black areas, Latino areas, etc. in the people of color, unemployment, and disconnected youth maps, and you can also filter by different measures of opportunity in the race/ethnicity map. To get to the race/ethnicity indicator, select Race/ethnicity (also in the Demographics menu).

    The default breakdown shows a chart of how the racial/ethnic composition of the country has changed from 1980 to 2010, and how it’s projected to change through 2040. Underneath the graphic display, you’ll see the different breakdowns, the second of which is the “Race and ethnicity map.” The default map is the percent people of color in 2014, but you can also look at the data from 2000. Under the year options, you’ll see the six major race/ethnicity groups and all people of color. If you select “Native American”, for example, you’ll get a map of the percent Native American by county. The darker purple counties represent areas with a Native population larger than 40 percent (see screenshot below).

    Using the opportunity filters

    The filters located on the bottom right of the page allow you create custom maps based on various measures of opportunity such as homeownership and the share of the population with an associate’s degree or higher. To illustrate how the filters work and how to access data by neighborhood, take the state of Mississippi as an example.

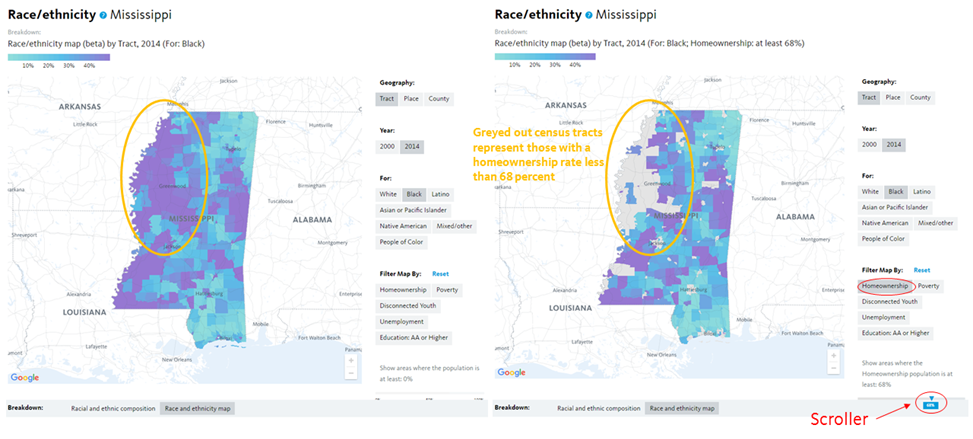
    You’ll notice that census tracts are not one of the geography options in the map above. In order to view the data by census tract, you must type in a state, region, or city in the Explore box. After typing in and selecting Mississippi, you get a map of the state by tracts (the default geography at the sub-national level). If you click on “Black”, you get a map of the Black population share. The purple tracts are neighborhoods with a Black population greater than 40 percent. The light blue areas, on the other hand, have a Black population under 10 percent.

    To use the filters, first select one, like homeownership, then move the scroller at the bottom to only show areas where the homeownership is at least a given percentage. The overall homeownership rate in Mississippi is 68 percent, but moving the scroller to 68 percent, creates a map of census tracts where the homeownership rate is 68 percent or higher and many of the purple tracts (representing majority Black tracts) in the northwestern part of the state disappear as a result (see maps below). Those tracts that disappear have a homeownership rate less than 68 percent.
    Using maps to inform decision-making

    These maps can be especially helpful in developing targeted employment or workforce development initiatives. The overall unemployment rate in Mississippi was 10 percent, but this was clearly not the case across all census tracts. Filtering the map by tracts with an unemployment rate of at least 15 percent produces a map with several majority Black tracts. This map can support programs and initiatives through the state workforce investment board by ensuring that resources are targeted to communities that need them most.

    Note: While the size (land area) of the census tracts in the state varies widely, each has a roughly similar number of people. A large tract in a more rural part of the state likely contains a similar number of people as a seemingly tiny tract in an urban area. Care should be taken not to pay an unwarranted amount of attention to large tracts just because they are large.

    Mississippi has the highest rate of disconnected youth of all states, so understanding how the number and share of disconnected youth varies across the state is central to developing an effective workforce development or education program. To find the map for disconnected youth, select “Disconnected Youth” in Readiness section of the Equity menu. The very last breakdown is the mapping breakdown. As you’ll see in the map below, there are several red census tracts, symbolizing areas where the share of disconnected youth is greater than 20 percent. As you hover over different tracts, you can see both the share and the total number of disconnected youth. In census tract 9504 in Prentiss County, for example, more than 100 young people, or 57 percent of 16 to 19 year olds, were disconnected from both school and work.

    The filters and scroller on this map allow you to visualize disconnectedness in relation to neighborhood composition. As you filter to majority White or majority Black neighborhoods, you’ll notice how disconnectedness varies geographically.

    For a walk through of the unemployment maps, view our previous blog. For a live walk through of the new maps, register for our webinar. Share your thoughts or questions during the webinar or through our contact form.


    This Atlas of Racial Equity Just Keeps Getting Better

    Cross-posted from CityLab

    How do race and inequality intersect with space? American mapmakers have been trying to answer this question since at least 1895, when a group of reform-minded Chicago women published the Hull-House Maps and Papers. At the height of the Gilded Age, inequality was skyrocketing. Housing and labor conditions among droves of new immigrants were dire.

    Putting their faith in data as catalyst for progress, the Chicago reformers meticulously surveyed the ethnicities and wages of industrial workers living in a tenement neighborhood on the Near West Side, and then plotted their findings in vivid color on a set of blank property maps. The result was a groundbreaking visual demonstration of poverty as a product of a person’s spatial context, rather than some damning individual quality—a belief that was commonly held then (as it is now).

    Flash-forward 120-plus years, and we’re living in an era some call a second Gilded Age. In fact, income inequality is even worse now than it was then. Mapmakers are still figuring out the best ways to plot disparities across all sorts of measures—jobs and school quality, environmental health, and transportation access, for example—to advocate for policy change. The National Equity Atlas, developed by PolicyLink and the University of Southern California’s Program for Environmental and Regional Equity (PERE), might be the best and most comprehensive graphic call for economic equality available today.

    Read the full article in CityLab.

    Pages