Reflecting on 2024: Key Atlas Updates and Partnerships

Dear Atlas Users,

As 2024 draws to a close, we’re taking a moment to reflect on the year. It’s been filled with meaningful collaborations, data-driven insights, and impactful projects that continue to drive positive change in communities across the country. As we wrap up the year, we’re excited to share some of the highlights from 2024, and we’re also looking ahead to 2025 with some exciting projects in store that will continue to advance data equity nationwide.
​​​​​
Empowering Communities with Data to Strengthen Local Action

This year, we collaborated on key projects to support regional equity efforts across the US. In California, we developed seven regional equity profiles to support the California Jobs First initiative, a $600 million statewide effort to drive investments that strengthen communities. These profiles cover regions such as the Central Coast, Inland Empire, and Southern Border, providing valuable data and insights to address long-standing inequities, promote climate resilience, and ensure that new development benefits communities of color and historically disinvested areas. We also partnered with local organizations in Long Island to produce an updated equity profile for the region, providing an in-depth analysis of its economic challenges, environmental justice issues, and health disparities. Both projects underscore the importance of localized, data-driven approaches to advancing equity, with the power to inform community-led solutions and shape policy for a more equitable future.

Making Waves in the Media

Throughout 2024, the Atlas was featured in several media outlets, amplifying the reach and impact of our work. In August, The Seattle Times referenced our data in a report on the rise of unpaid rent in low-income housing, shedding further light on the financial struggles tenants face as rental arrears continue to mount. In April, Shelterforce cited our data in its analysis of deepening rental arrears and increasing operational costs faced by affordable housing providers. Our rent debt data also made its way into Capital & Main, where it was featured in a story about a Los Angeles renter preparing to fight for his home in court. And our collaborative study with Rideshare Drivers United was mentioned in a CalMatters article discussing the implications of Prop 22 and its impact on gig economy workers. To explore more media coverage, visit our news archive.

Addressing Economic Insecurity and Housing Pressures

This year, we released two critical pieces of research that highlighted the growing disparities in housing and community well-being. Our report on economic insecurity and green space equity in Los Angeles County uncovered significant racial and economic disparities in access to green spaces, revealing how these gaps affect the quality of life and exacerbate broader economic inequalities. Meanwhile, a data snapshot we released earlier in the year delved into the growing pressure US renters feel to leave their homes, particularly in regions like the South and Southwest, where financial strains were most acute. These insights, which were incorporated into our rent debt dashboard, underscored the urgent need for stronger protections for renters and equitable solutions to improve both housing stability and access to essential community resources like green spaces.

Celebrating the Conclusion of the National Equity Atlas Fellowship

In the first quarter of 2024, the second cohort of National Equity Atlas Fellows completed their equity data projects. The program concluded with a Fellowship Showcase, where each of them presented their projects—ranging from a transit equity dashboard in New Orleans to a toolkit on economic disparities caused by heir properties in Detroit. Post-fellowship interviews with both cohorts provided valuable reflections on their skill development and impact. As we look ahead, we’re retooling the Racial Equity Data Lab and refining our approach to continue promoting research justice and advancing data equity in the field.

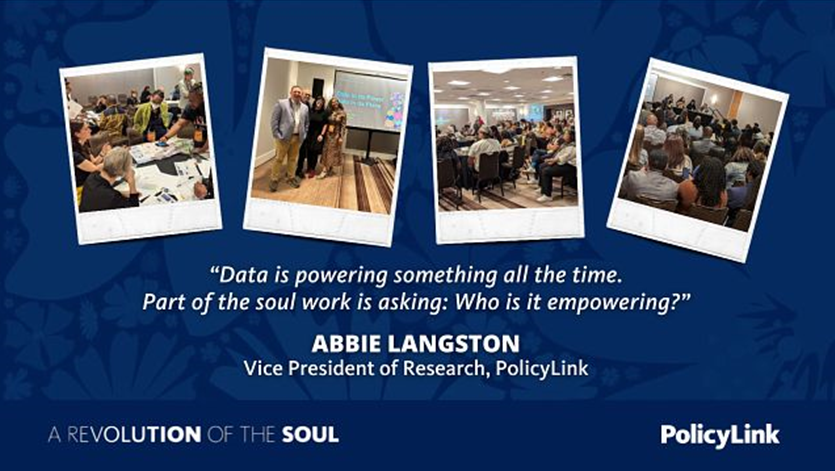
Driving Conversations on Data and Equity at the PolicyLink Equity Summit 2024

We hosted three sessions at this year’s PolicyLink Equity Summit, each showcasing innovative approaches to advancing equity through data and community engagement. The first session examined transformative data systems, exploring the balance between data disaggregation and holistic analysis, while also addressing the ethical considerations surrounding the use of big data. In the second session, we shared strategies for creating accessible and impactful data visualizations that can drive meaningful change. The third session offered an immersive experience, inviting participants to think beyond traditional indicators and imagine new ways to measure and promote community well-being. To dive deeper into the sessions and access the resources we shared, visit nationalequityatlas.org/equity-summit-2024.

Looking Forward to the New Year

Thank you for using the National Equity Atlas and for your ongoing commitment to advancing equity through data, research, and collaboration. We wish you and yours a joyful holiday season and look forward to an even more impactful 2025!

​​​​​​
— The National Equity Atlas Team at PolicyLink and the USC Equity Research Institute (ERI)

Summer Reflections and Resources from the Atlas

Dear Atlas Users,

As this summer winds down, we’re taking a moment to reflect on the incredible research and resources we’ve released throughout 2024. It’s been a productive year for the National Equity Atlas, and we’ve remained committed to providing advocates, policymakers, and community leaders with data-driven insights for driving meaningful change. As we look ahead, we’re excited to share some of our highlights from the year so far:


Atlas Sessions at the PolicyLink Equity Summit 2024

The Atlas hosted three sessions at this year’s PolicyLink Equity Summit, offering various approaches to advancing equity through data and community engagement. The first session explored transformative data systems, addressing the balance between data disaggregation and holistic analysis, blending humanistic storytelling with quantitative rigor, and navigating the ethical implications of big data. The second session showcased strategies for creating accessible and impactful data visualizations. The third session provided an immersive experience, encouraging participants to think beyond traditional indicators and envision new ways to measure whether a community is loving and thriving. These sessions underscored our commitment to rethinking data and design practices to better serve and empower communities. Learn more about each session, the lineup of speakers, and the shared resources.

New Report: Exploring Economic Insecurity and Green Space Equity in Los Angeles County

Our latest report dives into the intersecting challenges of economic insecurity and green space equity in Los Angeles County. This in-depth analysis uncovers the significant racial and economic disparities in access to green spaces, shedding light on how these gaps affect economic stability and overall well-being. By examining these interconnected challenges, the report offers valuable insights into how limited access to green spaces both reflects and exacerbates broader inequities. Delve into the report and the Green Space Equity Glossary, which provides essential definitions and key concepts related to the report’s findings.

Data Update: Rent Debt Dashboard

Rent debt remains a significant national crisis — and our updated Rent Debt Dashboard sheds light on this ongoing issue. As of July 22, more than 5 million renter households remain behind on their payments, accumulating more than $9.5 billion in total rent debt. This lingering debt has placed a disproportionate strain on low-income households and communities of color. Geographic disparities are also evident, with states like California and Texas showing some of the highest levels of rent debt. Dive into the data to see how rent debt varies across the US.

ICYMI: 2024 National Equity Atlas Fellowship Showcase

Our second cohort of fellows wrapped up their year-long journey this spring, culminating in a showcase of their visionary projects. The showcase highlighted the innovative strategies each fellow developed to address critical issues like housing affordability, climate change, the digital divide, and wage theft. Their recorded presentations provide a glimpse into how data can be leveraged to advance equity in local communities. The conclusion of our fellowship program has offered us valuable initial insights that will shape and guide our future initiatives.

​​​
We Want to Hear from You!

We value your insights and feedback as we continue to expand our resources. If you have found any of our research or tools useful, or if you have suggestions for how we can better support your work, don’t hesitate to reach out to us. Share your thoughts and stories with us at info@nationalequityatlas.org.

​​​​​​
— The National Equity Atlas Team at PolicyLink and the USC Equity Research Institute (ERI)

How Diverse Are Bay Area Elected Officials?

Dear Atlas Users,The Bay Area is one of the most ethnically and racially diverse regions in the nation, but is that diversity reflected in local political leadership? For the past five years, the Bay Area Equity Atlas has tracked data on the diversity of local elected officials. Our analysis of the latest data indicates that people of color still face significant barriers to accessing and exercising political power. Here’s more about political representation in the region and other updates from the Atlas:

Despite Some Progress, Bay Area Elected Officials Remain Disproportionately White

Our latest examination of the diversity of high-level Bay Area elected officials — mayors, city council members, supervisors, and district attorneys — reveals more people of color are running for office and winning local elections throughout the nine-county region. Between 2019 and 2023, the region’s share of elected officials of color increased from 29 percent to 37 percent. Despite this steady increase, people of color remain vastly underrepresented, given that they make up 60 percent of the region’s population. And 25 percent of Bay Area cities still have no people of color represented in their city government. 

Exploring the Impact of Unrepresentative Political Leadership on Legislation

How does the lack of diversity among Bay Area elected officials impact housing policy outcomes? 

To explore the relationship between real estate interests held by local elected officials and their voting patterns on housing legislation, we reviewed statements of economic interest forms for electeds in a sample of 20 cities and the region’s nine counties. Our review indicates that one in four elected officials have property interests, suggesting that the perspectives and experiences of renters may be underrepresented in local government decision-making.

In Focus: Fostering Diversity in Local Government

People of color account for 73 percent of Antioch’s total population, but only 45 percent of elected officials representing the city, which includes Contra Costa County electeds, are people of color.  When Antioch City Councilmember Tamisha Torres-Walker won her first term in 2020, she became the first Black Latina to join the five-member city council. She stepped into office clear on her priorities: to uplift and support communities of color. During her tenure, she has helped pass progressive policies like rent stabilization, guided the creation of a mobile mental health crisis team, and secured funding for transitional housing and violence prevention. Learn more about her story

Data Update: Bay Area Recovery Dollars Tracker

Cities and counties across the region are still deciding how they’ll invest their remaining share of flexible federal resources from the Coronavirus State and Local Fiscal Recovery Funds (SLFRF) program. Local governments have until the end of 2024 to obligate their SLFRF dollars. To continue bolstering efforts to ensure that policymakers use these funds equitably, we’ve updated the Bay Area Recovery Dollars Tracker to reflect local governments' allocation of SLFRF funds through March 31, 2023. Our assessment of the most recent public data reveals that Bay Area localities have made plans to spend $2.3 billion (70 percent) of the $3.3 billion SLFRF funds allocated to the region, leaving $972 million (30 percent) left to be allocated.

Meet Our New Team Member

You might have already noticed, but we recently added a new member to our team. Please help us officially welcome Ezinne Nwankwo. Shaped by her experiences as an immigrant from Nigeria, Ezinne’s research interests center on the migration and immigrant experiences of Black and African populations. Over the next year, she’ll serve as a postdoctoral research associate for the Atlas partnership, housed within the USC Equity Research Institute (ERI). We’re thrilled to have her on board to support our research and engagements!

Atlas in the News

Atlas data and insights have been featured in several local outlets over the past month. Here’s a brief roundup: Bay City News included data from our race/ethnicity indicator in a piece about efforts to boost political engagement among Bay Area youth ahead of the 2024 elections. As part of local coverage of labor activism, Axios highlighted our January 2023 analysis of the economic challenges facing workers as the region continues to recover from the Covid-19 pandemic. The San Francisco Examiner cited the Atlas in a piece about political representation in the city of San Francisco. Bay City News’ Kiley Russell partnered with the Atlas to leverage our data on the diversity of electeds in a piece about the ongoing underrepresentation of people of color in the halls of power. For more, explore our news archive.

Atlas on the Road

The Atlas team regularly engages with local advocates and organizations. Here’s a brief look at some of our recent presentations: On August 22, Michelle Huang conducted a walkthrough of the Atlas for staff from the City of San Jose. On August 23, Michelle joined SPUR for a panel discussion on how local agencies and organizations are supporting and sustaining the growth of small businesses owned by people of color. On September 20, Ryan Fukumori trained the staff of Richmond Neighborhood Housing Services on using the Atlas, leveraging Richmond and Contra Costa County housing data. Interested in hosting a presentation or training? Contact us at info@bayareaequityatlas.org.

Thank You,Bay Area Equity Atlas Team

See How the Bay Area’s Population Has Changed Since 2010

Dear Atlas users,

Recent headlines have focused on the Bay Area’s population loss over the last few years. But how did the region’s population — and its demographics — change during the 2010s? Our latest analysis explores the trends and what they mean for our future. Explore our findings and more updates from the Atlas:

At a Glance: The Bay Area’s Shifting Population

The Bay Area added more than half a million people between 2010 and 2020. However, our analysis of the latest decennial census data reveals that population growth during this period was uneven across the nine counties. Smaller cities in the East Bay and South Bay saw larger rates of population growth, while unincorporated areas in the North Bay and South Bay lost residents. The region’s racial and ethnic demographics are also quite different than they were a decade ago. By 2020, people of color and multiracial people comprised nearly two-thirds of all residents (64 percent), a notable rise from 50 percent in 2010. Despite this growth, Black and indigenous populations across the region have still declined.The Bay Area's Black, Native American, and white populations have decreased since 2000..

Advocating for Language Equity in the Bay Area

The nine-county Bay Area is home to speakers of more than 160 languages — and more than 200,000 households across the region don’t speak English well or at all. These linguistically isolated households largely speak Asian languages or Spanish. For farmworkers, many of whom speak other indigenous languages from Mexico, the situation is even more precarious: safety messages aren’t often translated into the languages they speak. Maria Salinas, a farmworker and organizer who predominantly speaks Chatino, has pushed to increase language access. In 2022, she and other farmworkers successfully advocated for the creation of an emergency operations plan that requires employers in Sonoma County to provide safety training and information to workers in their preferred languages. Learn more about her story.

ICYMI: Examining the Diversity of Bay Area Elected Officials

Our latest examination of the diversity of high-level Bay Area elected officials — mayors, city council members, supervisors, and district attorneys — reveals more people of color are running for office and winning local elections throughout the nine-county region. Between 2019 and 2023, the region’s share of elected officials of color increased from 29 percent to 37 percent. Despite this steady increase, people of color remain vastly underrepresented, given that they make up 60 percent of the region’s population. And 25 percent of Bay Area cities still have no people of color represented in their city government. Want to delve deeper? Explore our case study on the relationship between real estate interests held by local elected officials and their voting patterns on housing legislation.

Connect with Our Team

The Atlas team regularly engages with local advocates and organizations — and we’d love to. Interested in hosting a presentation or training? Contact us at info@bayareaequityatlas.org.

Thank you,

Bay Area Equity Atlas team

How Much Does Policing Really Cost?

The National Equity Atlas is excited to announce the release of our latest data tool — At What Cost? Examining Police, Sheriff, and Jail Budgets Across the US. The interactive dashboard explores how much cities and counties across the nation spend on policing and incarceration.


Research has shown that local governments in the United States are dedicating more funds to carceral systems, like jails and law enforcement. At What Cost? sheds further light on this trend. Using data from the fiscal year 2022 budget allocations of 20 US cities and counties, the dashboard compares local spending on carceral activities with money allocated toward community investments that contribute to residents’ well-being — like housing, health care, and social services.


What the Dashboard Does

At What Cost? is a valuable tool for anyone working to promote transparency and accountability in local government. It enables users, including residents, advocates, and policymakers, to:

  • Understand how their tax dollars are being spent.
  • Assess their community’s spending priorities and compare them to other cities and counties.
  • Identify budget trends, funding disparities, and potential areas for reform.

How to Navigate the Dashboard

Unsure where to get started? We've developed a user guide to help you make full use of the dashboard and its data. It highlights key features and provides step-by-step instructions on accessing and interpreting local budget data.

Get Further Support

Have questions about the dashboard or its data? Explore our frequently asked questions. Don't see your question listed, or need one-on-one support? Please submit a request.

May 2023

U.S. Senate Hearing: Water Affordability and Small System Assistance

Overview

Kyle Jones, Legal and Policy Director with Community Water Center and WECR Caucus steering committee member, testifies before the U.S. Senate Environment and Public Works subcommittee on Fisheries, Water and Wildlife. Watch the proceedings or download Kyle's testimony.

Advancing Youth Voter Participation and Civic Engagement in the Bay Area

Dear Atlas users,

Throughout American history, youth-led movements have brought about significant social transformation. Our latest feature story highlights how Bay Area youth are ensuring they are represented and included in local politics. Here’s a look into their efforts and other updates from the Atlas:

Landmark Settlement Reached on Behalf of Californians Struggling with Pandemic Rent Debt

The Alliance of Californians for Community Empowerment (ACCE Action), Strategic Actions for a Just Economy (SAJE), and PolicyLink — represented by Western Center on Law & Poverty, Public Counsel, the Legal Aid Foundation of Los Angeles, and Covington & Burling LLP — have settled a major lawsuit against the California Department of Housing & Community Development (HCD) over the administration of the statewide Covid-19 rent relief program. In June 2022, the advocacy groups sued HCD for several systemic failures in the program, including a confusing application process that led eligible tenants to be wrongfully denied assistance. In total, more than 460,000 California renter households applied to the program, with 89,000 of those applicants being Bay Area tenants. More than 100,000 households across the state are still waiting for a decision on their applications, according to our analysis of program data. The agreement requires HCD to give pending and denied applicants a fair chance to receive Covid-19 rental assistance. To learn more about the settlement and what it means for tenants, visit carentrelief.org.

In Focus: Youth Voter Engagement in the Bay Area

From demanding gun-control legislation to rallying support for climate justice policies, young people across the nation have led the way on social and political change. In Oakland, California, a coalition of youth organizers is behind Oakland Youth Vote — a campaign aimed at securing voting rights for 16- and 17-year-old Oakland students. Ixchel Arista, a recent graduate of Oakland High and youth organizer with Oakland Kids First (OKF), has been an integral part of the movement. She and other young activists helped push for the landmark passage of Measure QQ in 2020, which lowered the voting age to 16 for local school board elections and made Oakland the largest jurisdiction to approve of 16-year-old voting in any form. Although Ixchel will be heading to college soon, she says that she’ll continue to support efforts to get more young people civically engaged. Learn more about her story.


Ixchel Arista, a Bay Area youth organizer, poses for a photo in Oakland. Photo: Felix Uribe

Atlas on the Road

As a living resource, we connect with groups across the region to increase awareness of the Atlas and build local leaders’ capacity to use the tool. Here’s a brief look at some of our recent presentations: On June 15, Michelle Huang and Simone Robbenolt facilitated a session at Governing for All: California, a convening hosted by the Government Alliance on Race and Equity (GARE) in partnership with PolicyLink and State of Equity. During it, participants learned how to use the Atlas as a tool for finding disaggregated data and local strategies to support their work. On June 13, Ryan Fukumori joined Omar Carrera, the CEO of the Canal Alliance, and Sukey Leshnick, the director of strategic learning and evaluation at the San Francisco Foundation, to facilitate a session about the role of disaggregated data in shaping strategy and policy campaigns during the Leading Locally 2023 Conference in Denver, Colorado. On June 9, he presented during a housing data infrastructure workshop hosted by San José State University and TechEquity Collaborative. On May 26, he showcased the Atlas and shared best practices in research justice and data equity during a training session for Contra Costa Health Services’ Workforce Health Ambassador program participants. And Ryan joined Thrive Alliance's Resource Room on May 23, where he gave a brief presentation on current Atlas research and ways in which local organizations can leverage our data to support their efforts. Interested in hosting a presentation or training? Contact us at info@bayareaequityatlas.org.

We Want to Hear from You!

If you’ve found any of our data, research, or resources valuable, please let us know. Share your questions, thoughts, and stories with us at info@bayareaequityatlas.org.

Thank you,

Bay Area Equity Atlas team

Rent Debt Continues to Burden Renters Across the Nation

Dear Atlas users,

Millions of households across the United States are still struggling with massive amounts of back rent, putting them and their families at risk for eviction. Use the Rent Debt Dashboard to delve deeper into the latest data on rent debt in the US. Here are more updates from the Atlas:

Landmark Settlement Reached on Behalf of Californians Struggling with Pandemic Rent Debt

The Alliance of Californians for Community Empowerment (ACCE Action), Strategic Actions for a Just Economy (SAJE), and PolicyLink — represented by Western Center on Law & Poverty, Public Counsel, the Legal Aid Foundation of Los Angeles, and Covington & Burling LLP — have settled a major lawsuit against the California Department of Housing & Community Development (HCD) over the administration of the statewide Covid-19 rent relief program. In June 2022, the advocacy groups sued HCD for several systemic failures in the program, including a confusing application process that led eligible tenants to be wrongfully denied assistance. According to Atlas analyses, more than 460,000 California renter households applied to the program and more than 100,000 households are still waiting for a decision on their applications. The agreement requires HCD to give pending and denied applicants a fair chance to receive Covid-19 rental assistance. To learn more about the settlement and what it means for tenants, visit carentrelief.org.

Data Update: Rent Debt Dashboard

Rent debt remains at crisis levels across the nation. To continue supporting advocacy efforts and policy action, we’ve updated the Rent Debt Dashboard. The latest data shows that nearly six million renter households remain behind on their rent as of May 8 — about double the pre-pandemic baseline. Altogether, they owe more than $10 billion in total rent debt, with the majority of those behind on rent being low-income people of color.

ICYMI: The Uneven Geography of Affordability for Asian American and Pacific Islander Renters

Asian Americans and Pacific Islanders (AAPIs) are among the fastest-growing communities across the US: between 2010 and 2019, the AAPI population grew by 18 percent, whereas the overall US population grew by only 5 percent. However, the AAPI experience in the US is not monolithic. The second report in our series exploring the changing geography of opportunity in US metros indicates that different AAPI subgroups and ethnicities have widely divergent experiences with rental affordability, with Pacific Islanders experiencing the steepest challenges. Want to delve deeper? You can use this dashboard to explore the differences between and within AAPI communities across the nation.

Atlas in the News

Over the past few months, Atlas data and analyses have been cited by dozens of news outlets, including AxiosMarketWatchLos Angeles TimesTMJ4 News, and The Wall Street JournalTo explore more of our media coverage, visit our news archive.

Atlas on the Road

The Atlas team and our partners facilitate learning sessions and provide presentations on a regular basis to share new data, indicators, best practices, and functionalities. Here’s a brief look at some of our recent presentations: On June 15, Michelle Huang and Simone Robbenolt facilitated a session at Governing for All: California, a convening hosted by the Government Alliance on Race and Equity (GARE) in partnership with PolicyLink and State of Equity. During it, participants learned how to use the Atlas as a tool for finding disaggregated data and local strategies to support their work. Simone and Michelle facilitated a virtual session with the 2023 Transformative Justice Infrastructure Fellows on June 8, where they did a walkthrough of how the Atlas could support the implementation of transformative infrastructure-related projects, programs, and processes. On June 9, Selena Tan and Seleeke Flingai joined experts from Recidiviz and the Black Wealth Data Center at a Data Funders Collaborative monthly town hall for a panel discussion about creating a demand for public data with a lens on equity. On June 1, Seleeke and Edward-Michael Muña demonstrated how Atlas data can be put into action through a brief showing of the regional equity profiles being built to support community groups that are looking to leverage funds from the statewide Community Economic Resilience Fund (CERF) program. The session was part of the Community Economic Mobilization Initiative (CEMI) learning series. To learn more, download the slide deck from the session or watch the session recording. On May 25, Selena showcased the Atlas and our approach to data equity at the Leadership Conference Education Fund ’s Data Disaggregation Action Network meeting. On April 28, Michelle and Selena presented at the 2023 KIDS COUNT Data Institute, which was hosted by the Annie E. Casey Foundation. During the session, they delved into the Atlas’ approach to data equity and data democratization in developing analyses and working with community-based organizations on equity policy. Interested in hosting a presentation or training? Contact us at info@nationalequityatlas.org.

— The National Equity Atlas Team at PolicyLink and the USC Equity Research Institute (ERI)

Examining Affordability for Asian American and Pacific Islander Renters in Metro America

Dear Atlas users,

Atlas data shows that at least half of renters are currently rent burdened in 57 of the 100 largest cities in the United States. Research has shown that rent-burdened households are more likely to experience financial instability and be at risk of eviction. Through our research, we continue to explore how housing unaffordability impacts families across the nation. Here are the latest updates from the Atlas:

New Atlas Research Illustrates The Uneven Geography of Affordability for Asian American and Pacific Islander Renters

The second report in our series exploring the changing geography of opportunity in American metropolitan regions indicates that Asian American and Pacific Islander (AAPI) renters experienced an uneven distribution of housing affordability across ethnic groups and geographic regions during the period between the Great Recession and the Covid-19 pandemic. Our analysis of changes in market rent and median household income for AAPI residents in the 100 largest US metros shows that AAPI residents have been disproportionately concentrated in the least affordable regions. It also underscores that AAPI communities’ relatively high median incomes can obscure the presence of many low-income AAPI renters who struggle with finding safe and secure housing. To further illustrate these findings, we explore the various housing challenges that AAPI residents face in the Honolulu, Atlanta, Philadelphia/New York, and Los Angeles metropolitan areas. Visit the project page to assess other resources, including a dashboard you can use to explore the differences between and within AAPI communities across the US.

An Equity Profile of Kalamazoo County

Kalamazoo County, Michigan, is growing more diverse. But our latest equity profile — developed in partnership with the Kalamazoo Community Foundation and local community leaders — details how a long history of racial discrimination and disinvestment in the region’s communities of color have created entrenched and persistent racial inequities in employment, income, wealth, education, health, justice, housing, and transportation. These growing gaps are costing the county an estimated $1 billion in potential economic growth each year. Learn more.

Data Update: Rent Debt Dashboard

Our updated Rent Debt Dashboard shows that more than 5 million renters remain in debt, with an estimated total rent debt of more than $11 billion nationwide, as of April 10. The majority of those behind on rent are low-income people of color. This new data underscores the magnitude of the rent debt crisis in communities across the country and the continued urgency of providing tenant protections to keep families in their homes and curb the surge of evictions that have followed the end of pandemic eviction moratoriums.

Meet the 2024 Class of National Equity Atlas Fellows

In case you missed it, we announced our second cohort of equity champions — 10 grassroots leaders of color from across the nation who will spend the next year sharpening their data skills and producing new data visualizations and other research products to strengthen their organization’s policy and advocacy campaigns. In the face of mounting challenges, the Atlas remains committed to bolstering the impact of dedicated advocates who reflect the communities they serve, which is a critical ingredient to winning on equity. Learn more about our fellowship program.

Atlas in the News

Over the past few months, Atlas data and analyses have been cited in dozens of news articles: Findings from our September 2022 report on Prop 22’s impact on rideshare drivers was cited in a piece from The San Francisco Standard about rideshare and food delivery drivers grappling with tipping issues. The report was also cited in a piece from The Guardian about drivers calling for the regulation of rideshare companies. Our rent debt data was cited in a CalMatters article on rising evictions in Los Angeles County and a CNBC article detailing solutions for those grappling with rent debt. To explore more of our media coverage, visit our news archive.

We Want to Hear from You!

If you’ve found any of our data, research, or resources valuable, please let us know. Share your questions, thoughts, and stories with us at info@nationalequityatlas.org.

— The National Equity Atlas Team at PolicyLink and the USC Equity Research Institute (ERI)

Pages