PolicyLink Applauds Court’s Refusal to Reinstate Ban

The 9th Circuit, affirming the Court's right to review the president's action, refused to reinstate the Administration’s travel ban, thus upholding the nation's commitment to just and fair inclusion, at least for now.  Where you come from, where you live, and how—or if—you worship, may not be a basis for exclusion from the country without due process. Anything less, “runs contrary to the fundamental structure of our constitutional democracy.”

Today’s win is a small victory in a battle of immense proportions. Savor small victories, even as we gird ourselves for the next fight.

All-In Cities Update: December 12, 2016

In the aftermath of November 8, it is clearer than ever that cities and the counties and metropolitan regions in which they are situated are the crucibles where an inclusive American economy and democracy can and must be forged. From Atlanta to Indianapolis, cities across the country passed ballot measures designed to expand opportunity and dismantle barriers to inclusion. In our hometown of Oakland, the anti-displacement and equitable infrastructure measures we supported won handily. As the All-In Cities team plans for the year ahead, we are look forward to continuing to help local leaders ensure that the cities they love are places where all can thrive and participate in building the next economy. 
 
Building Community Power in the Age of Trump
Following the election, associate director Tracey Ross wrote a piece for Rooflines, the Shelterforce blog, critiquing post-election narratives. She explains, “As the media and national figures continue to tell a story that overlooks how the concerns of people of color may have impacted the election, local leaders must be working to ensure workers of color are empowered to tell their own story.” Check out the full piece here.  
 
Buffalo: Health Equity and Inclusive Growth Profile Launched
With support from the Robert Wood Johnson Foundation, PolicyLink has partnered with Open Buffalo, a community coalition focused on justice and equity in the city of Buffalo, to produce a comprehensive equity profile that can inform policy solutions for health equity, inclusive growth, and a culture of health in the “Queen City.” We kicked off the engagement with a site visit on December 1 that included tours of West Buffalo and the historic Fruit Belt neighborhoods, interviews with community and city leaders, and a review of the initial data. We will be releasing the report and policy agenda in March 2017. 
 
Pittsburgh: Next City Highlights Equitable Development Momentum
Next City covered the progress that has been made since the release of Equitable Development: The Path to an All-In Pittsburgh in September. Senior director Sarah Treuhaft discusses the growing momentum among community leaders. “When we started working there, there was definitely not that sense that change was possible,” she explained. “By next year we want to see more of that, and create a sense that change is happening — that it’s not just possible but it’s actually happening and progress is being gained.” You can read the whole article here.
 
New Equitable Growth Data for Cities
The National Equity Atlas, produced in partnership with the USC Program for Environmental and Regional Equity (PERE), continues to expand to meet the data needs of those working to advance equitable growth in cities and metros. In October we added new neighborhood-level maps for four indicators, including unemployment and disconnected youth. And in November we updated 17 of our 32 indicators to 2014 five-year pooled data (it was previously the 2012 five-year pooled data).

Learn more about our All-In Cities initiative and sign up for updates at www.allincities.org.

buildings-houses

Chart of the Week: Large Urban Counties are at the Forefront of America's Demographic Change

To add equity data to the national dialogue about growth and prosperity, every week the National Equity Atlas team posts a new chart from the Equity Atlas related to current events and issues.

It’s been well reported that Hillary Clinton, despite failing to secure the necessary 270 Electoral College votes, won the popular vote by more than 2 million ballots. At the same time, county-level maps of election results show a sea of red. There are now nine times as many “Republican landslide counties” (counties that went Republican by more than 20 percentage points) than “Democratic landslide counties” according to The New York Times. But the areas where Trump won big are less populated than the areas where Clinton won big: the 2,232 Republican landslide counties have less people overall than the 242 Democratic landslide counties. And according to a Brookings analysis, the less than 500 counties that went Democratic made up 64 percent of total U.S. economic activity in 2015.

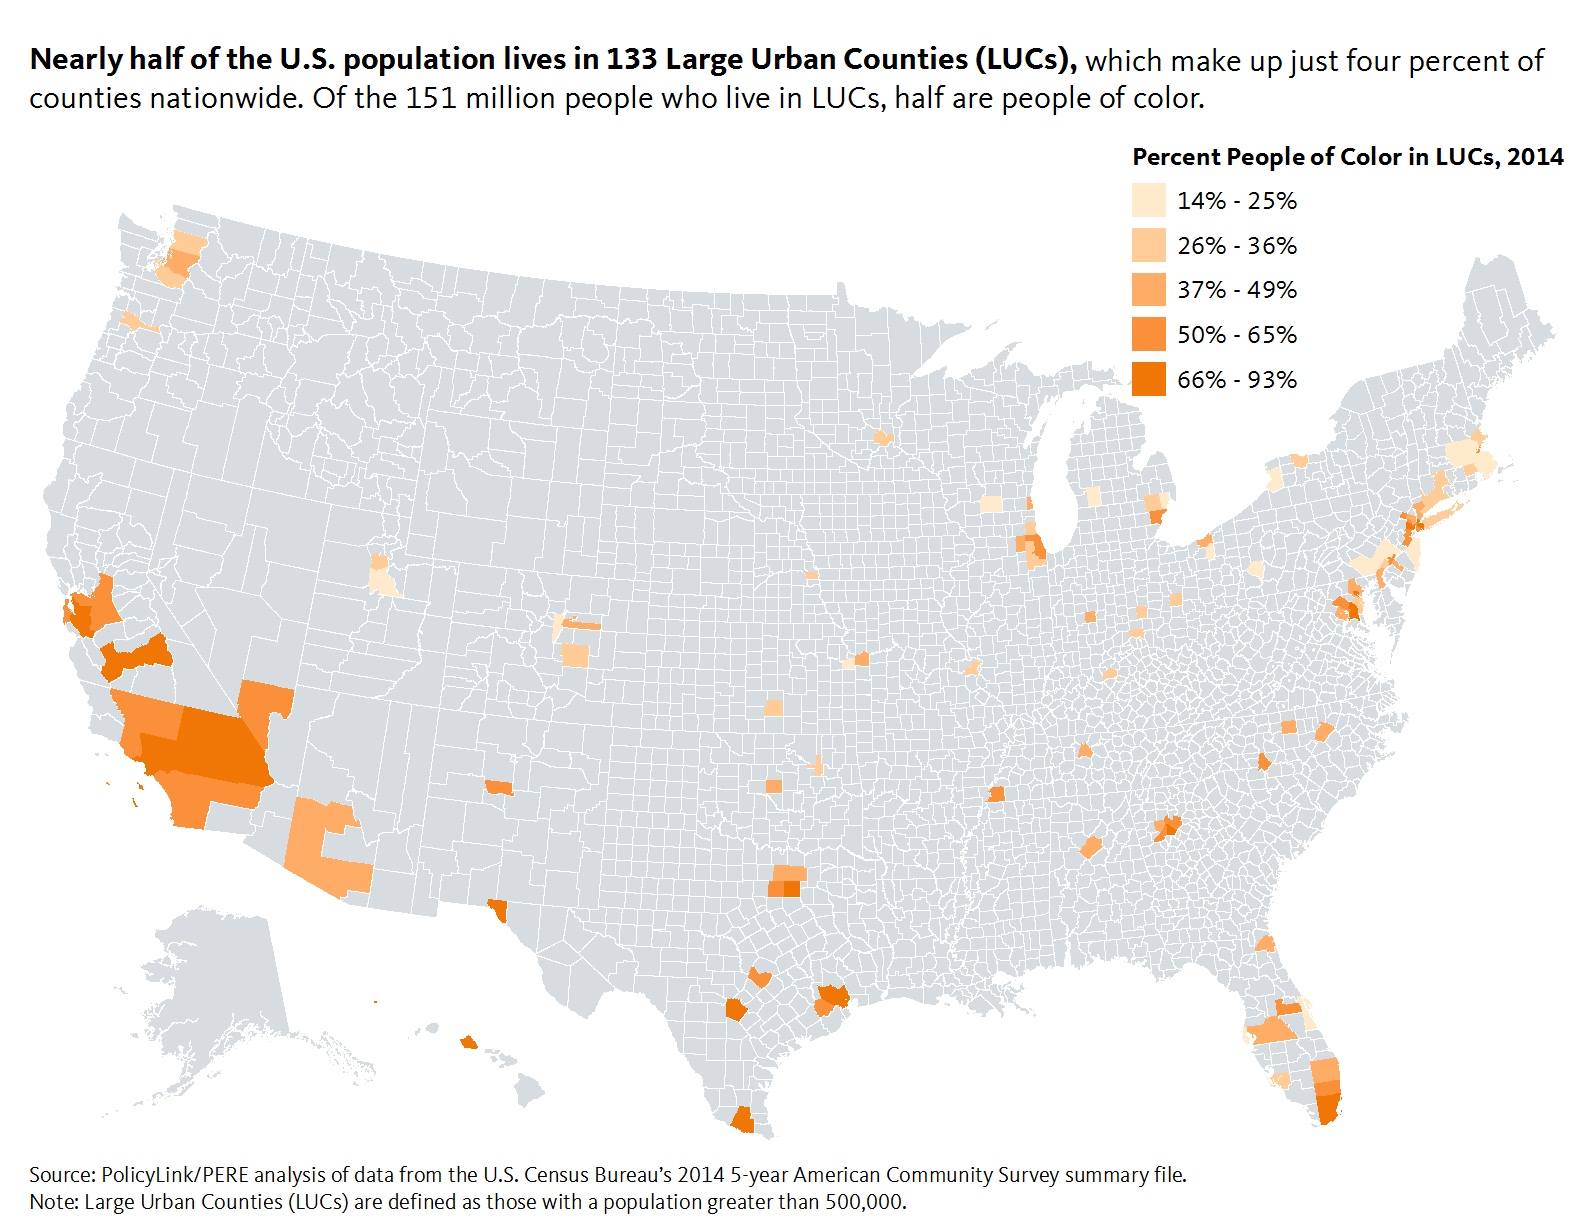
Our analysis of Large Urban Counties (LUCs), counties with more than 500,000 residents, underscorces just how urban and diverse the country has become. LUCs are not just the economic powerhouses of the country, they are also home to a disproportionate share of people of color.

This week’s chart draws from the new people of color maps added to Atlas to highlight how the nation’s most populous, “high output” counties are at the forefront of America’s demographic changes. In 2014, there were 133 LUCs, accounting for just four percent of counties nationwide. Of these 133 counties, 52 are already majority people of color and 18 are two-thirds people of color. The U.S. population as a whole is just 37 percent people of color, but half of the 151 million residents of LUCs are people of color.

LUCs are major economic actors and have a unique opportunity to advance equitable economic policies. Last month, Angela Glover Blackwell, CEO of PolicyLink, in her address to the Large Urban County Caucus (LUCC) of the National Association of Counties, highlighted several strategies that LUCs can adopt to catalyze equitable growth, including the integration of health and human services into development through investing in the residents and workers as well as the built environment.

To see how population and the share of people of color vary by county in your region, visit the National Equity Atlas, type in your state or region, and share the map for your community using #equitydata.

Chart of the Week: Vote for Candidates Who Will Invest in our Future

To add equity data to the national dialogue about growth and prosperity, every week the National Equity Atlas team posts a new chart from the Equity Atlas related to current events and issues.

News stories about broad demographic shifts and the changing face of America are increasingly common. Last year, California — the most populous state in the nation — became the fourth “majority-minority” state. Already the majority of youth under age 5 nationwide are people of color, and by 2044, the nation will be majority people of color.

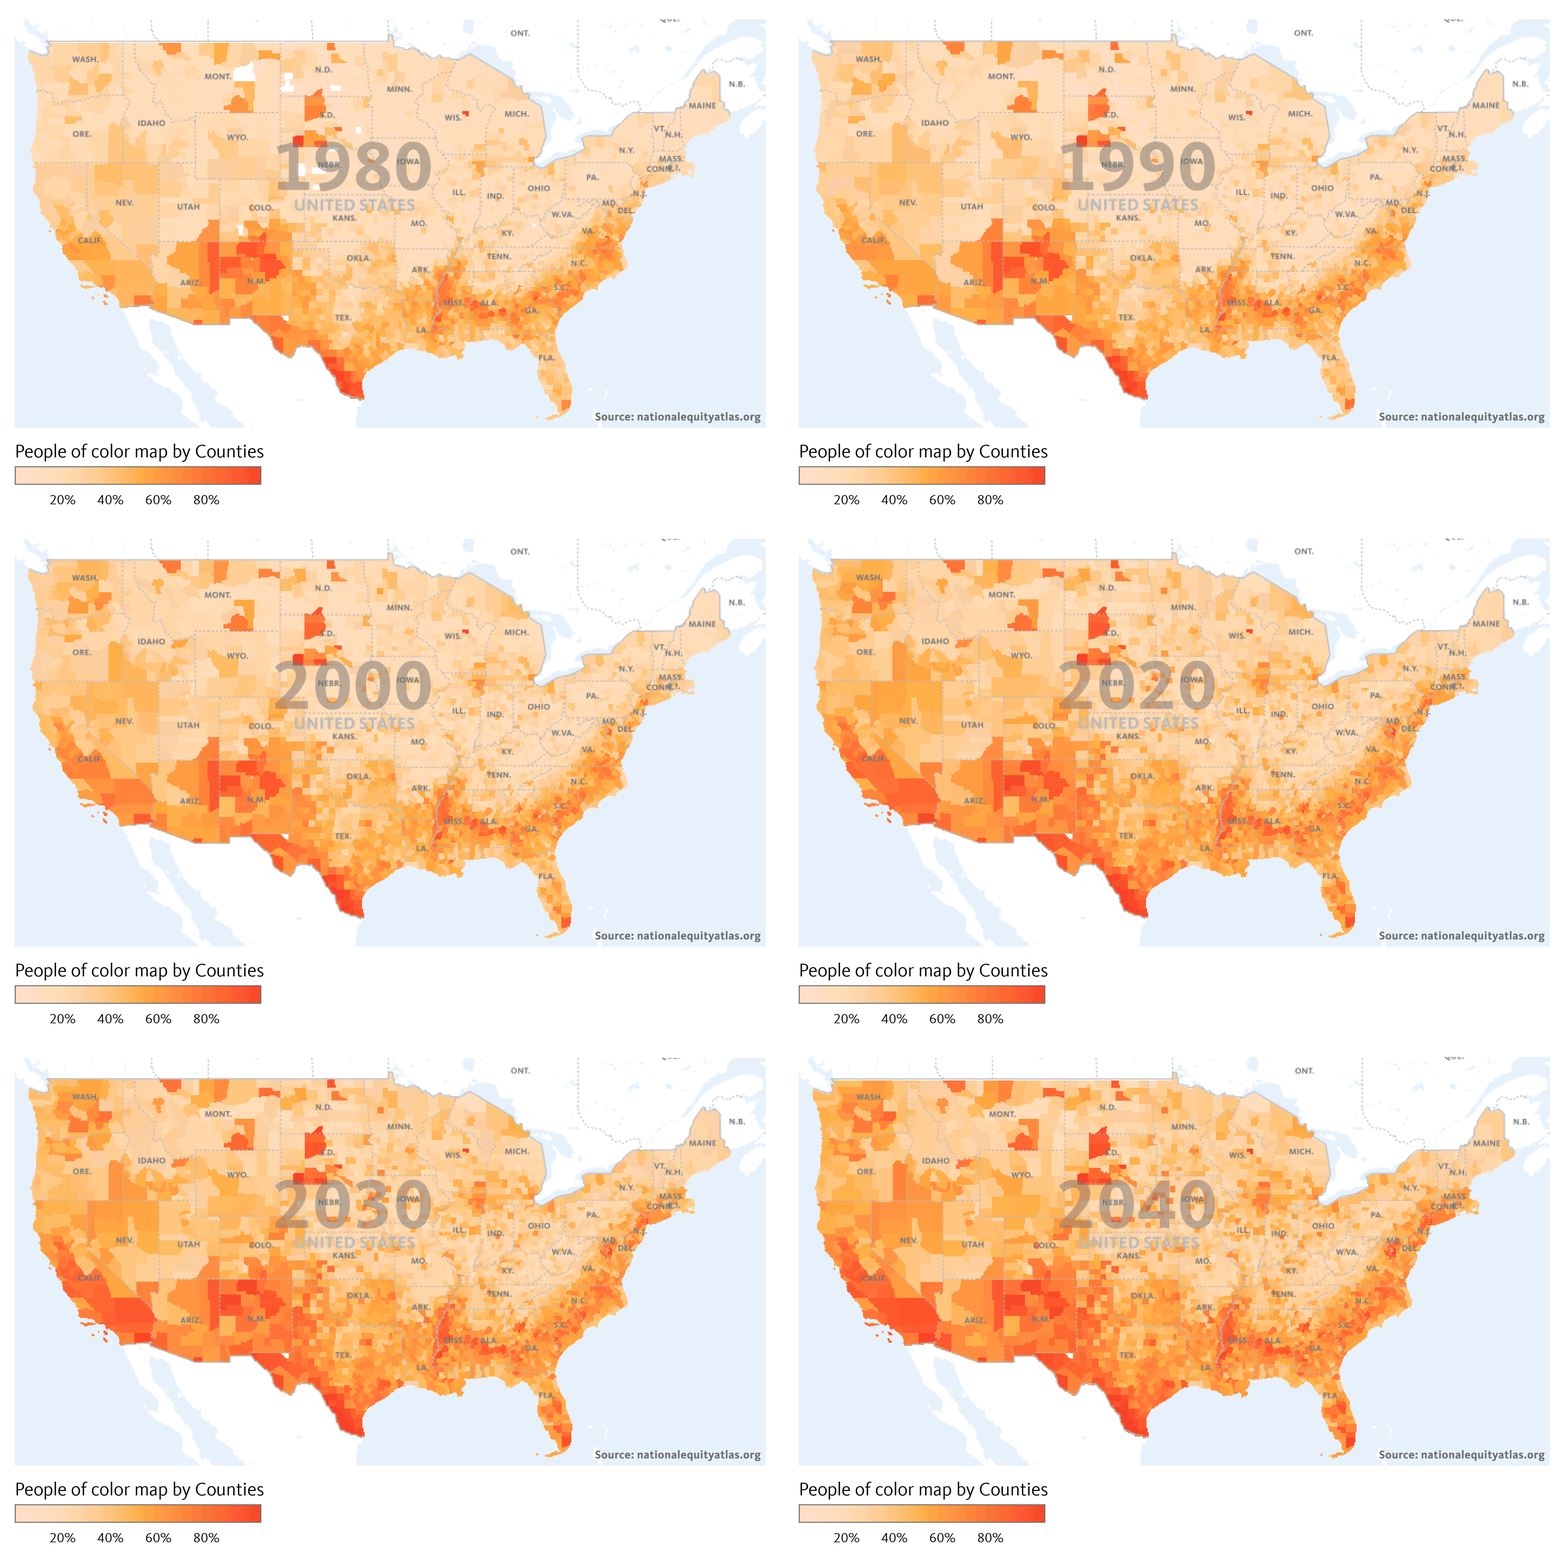
Today’s policy decisions will affect the future growth and prosperity of the nation for years to come. To illustrate the importance of racial equity, this week’s chart is a GIF showing the percent people of color in the U.S., by county, from 1980 to 2040. With each decade going forward, the strength of our economy increasingly depends on the readiness and full inclusion of people of color as workers, innovators, entrepreneurs, and leaders. On Tuesday, vote for candidates who will invest in our future workforce and build an economy that works for all.

In 1980, the U.S. was 20 percent people of color. The dark orange counties, representing areas where people of color comprised more than 80 percent of the population, were located throughout the South and Southwest, with the exception of Native American reservations in the Dakotas and Wisconsin. From 1980 to 2020, the share of people of color in the United States is expected to more than double to 41 percent. By 2040, the U.S. is projected to be 49 percent people of color.

According to 2015 Census data, 370 counties, home to nearly one in three Americans, are already majority people of color. That’s up from 339 counties in 2010. Some of the counties that have become majority people of color in the last five years include parts of Fort Worth and Austin in Texas and Charlotte, North Carolina.

To see how the share of people of color is expected to change through 2040 in your community, visit the National Equity Atlas, and type in your region or state. Download the chart and share it on social media using #equitydata.

This Atlas of Racial Equity Just Keeps Getting Better

Cross-posted from CityLab

How do race and inequality intersect with space? American mapmakers have been trying to answer this question since at least 1895, when a group of reform-minded Chicago women published the Hull-House Maps and Papers. At the height of the Gilded Age, inequality was skyrocketing. Housing and labor conditions among droves of new immigrants were dire.

Putting their faith in data as catalyst for progress, the Chicago reformers meticulously surveyed the ethnicities and wages of industrial workers living in a tenement neighborhood on the Near West Side, and then plotted their findings in vivid color on a set of blank property maps. The result was a groundbreaking visual demonstration of poverty as a product of a person’s spatial context, rather than some damning individual quality—a belief that was commonly held then (as it is now).

Flash-forward 120-plus years, and we’re living in an era some call a second Gilded Age. In fact, income inequality is even worse now than it was then. Mapmakers are still figuring out the best ways to plot disparities across all sorts of measures—jobs and school quality, environmental health, and transportation access, for example—to advocate for policy change. The National Equity Atlas, developed by PolicyLink and the University of Southern California’s Program for Environmental and Regional Equity (PERE), might be the best and most comprehensive graphic call for economic equality available today.

Read the full article in CityLab.

Introducing New Neighborhood Opportunity Maps


We know that opportunity differs by neighborhood, and maps are one way to visualize this variation across a given city, region, or state. That’s why today, we are adding mapping breakdowns to the following four indicators on the National Equity Atlas:


These new interactive maps allow you to visualize data by county or by census tract as well as by city, region, or state. You can also toggle back and forth between different years to see how the geography of opportunity has changed over time and create custom maps using an interactive filter and scroller. On the race/ethnicity map, for example, the scroller allows you to visualize measures of opportunity (e.g. homeownership) in relation to neighborhood composition (e.g. the share of the Latino population). And on the disconnected youth and unemployment maps, the scroller allows you to visualize the indicator as neighborhood compositions (e.g. share of the Black or Native American population) vary.

This blog walks you through how to access and use the new maps. Register for our 30-minute webinar on November 2 for a live walk through.

How to find the new maps

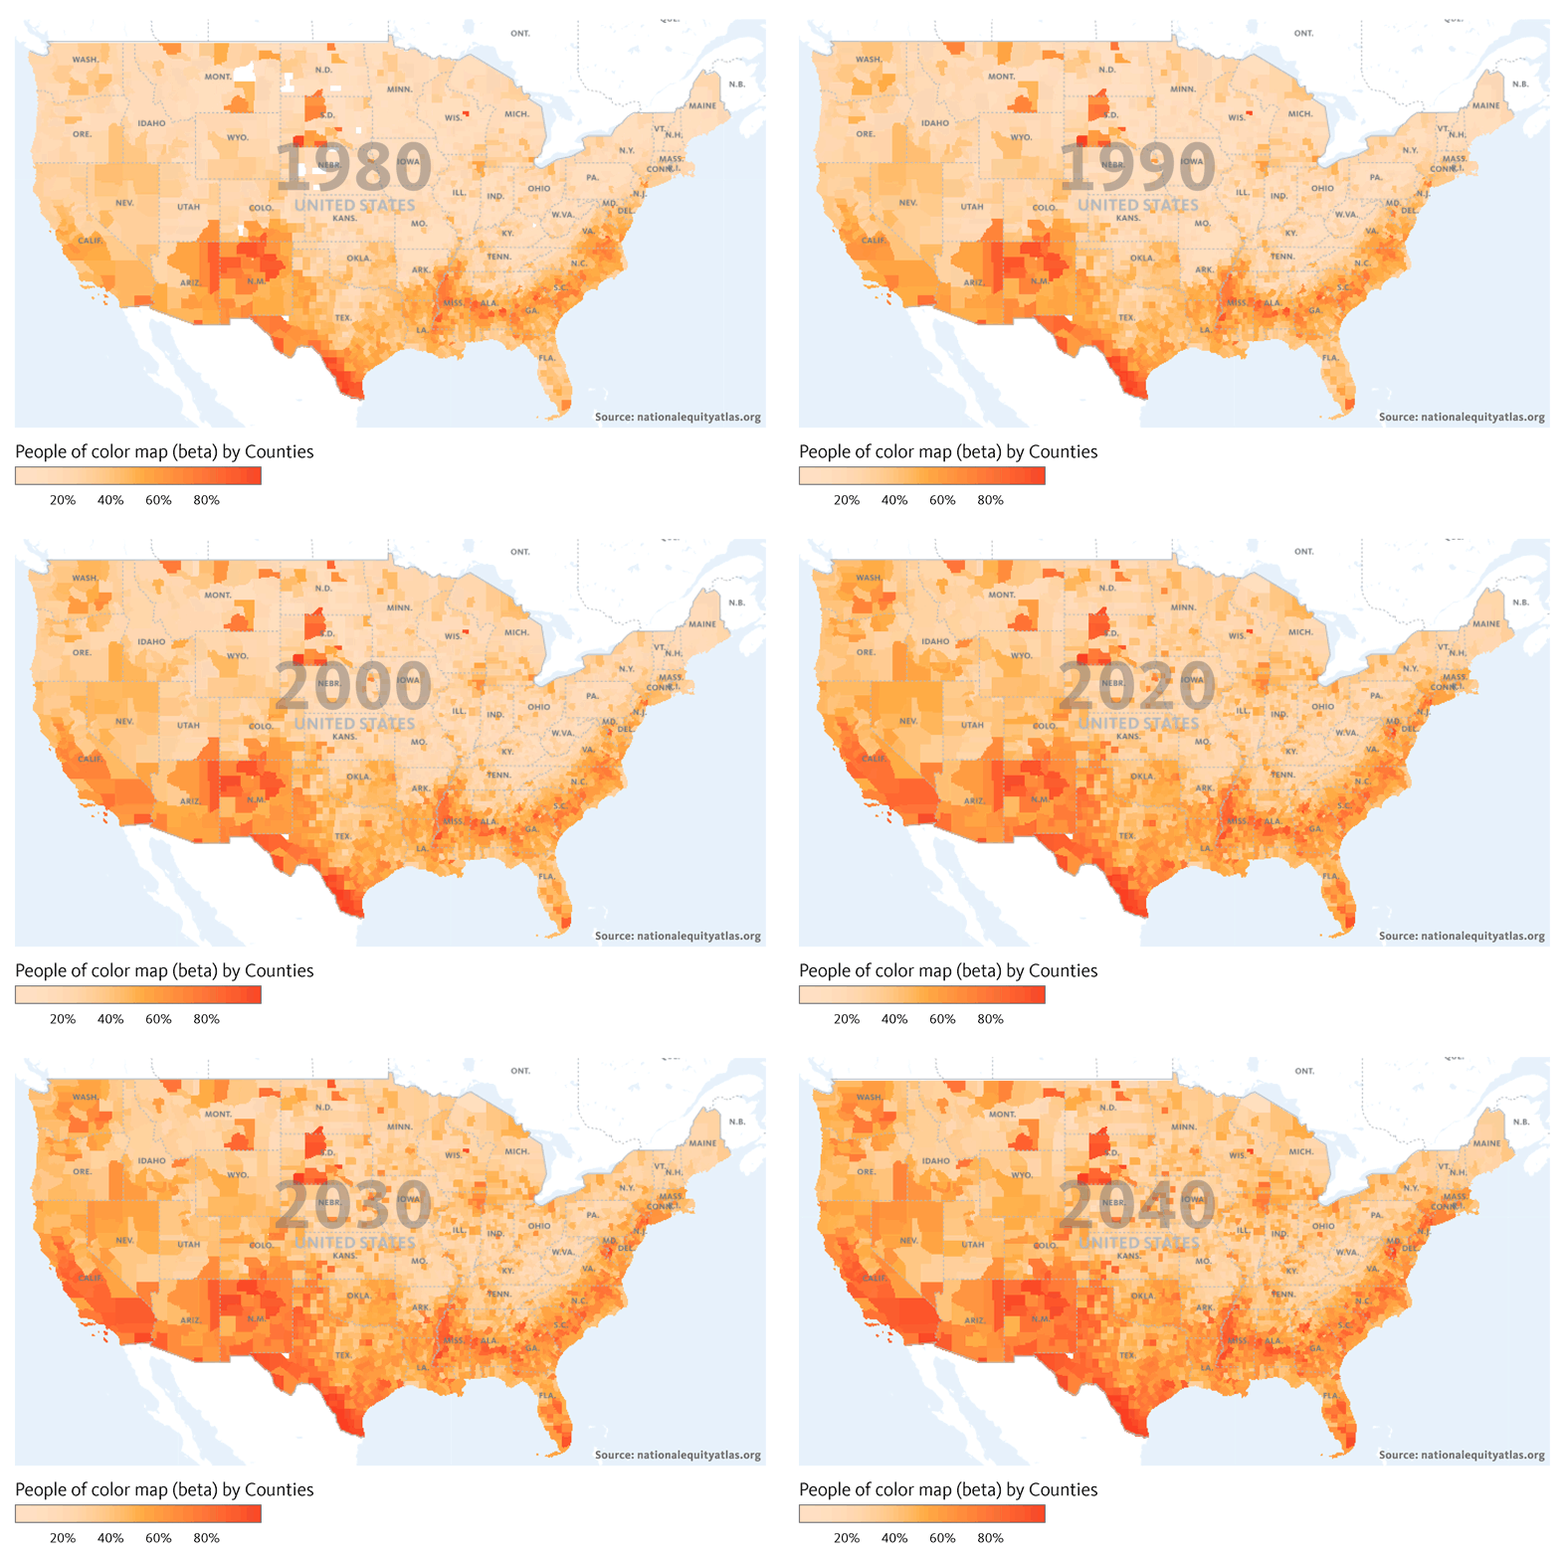
To access the new maps for the people of color indicator, click on the Indicators tab in the top navigation bar. Then under the Demographics menu, select “People of color.” You can look at the data by county (the default), by the largest 150 regions, or by state. You can also toggle back and forth between every decade from 1980 to 2040 to see how the share of people of color in the U.S. has changed over time. The GIF below pulls from the new maps to show how the share of people of color has changed from 1980 to 2010 and how it is projected to change by 2040. You can also see the new people of color map on the homepage of the Atlas.
You can filter by White areas, Black areas, Latino areas, etc. in the people of color, unemployment, and disconnected youth maps, and you can also filter by different measures of opportunity in the race/ethnicity map. To get to the race/ethnicity indicator, select Race/ethnicity (also in the Demographics menu).

The default breakdown shows a chart of how the racial/ethnic composition of the country has changed from 1980 to 2010, and how it’s projected to change through 2040. Underneath the graphic display, you’ll see the different breakdowns, the second of which is the “Race and ethnicity map.” The default map is the percent people of color in 2014, but you can also look at the data from 2000. Under the year options, you’ll see the six major race/ethnicity groups and all people of color. If you select “Native American”, for example, you’ll get a map of the percent Native American by county. The darker purple counties represent areas with a Native population larger than 40 percent (see screenshot below).

Using the opportunity filters

The filters located on the bottom right of the page allow you create custom maps based on various measures of opportunity such as homeownership and the share of the population with an associate’s degree or higher. To illustrate how the filters work and how to access data by neighborhood, take the state of Mississippi as an example.

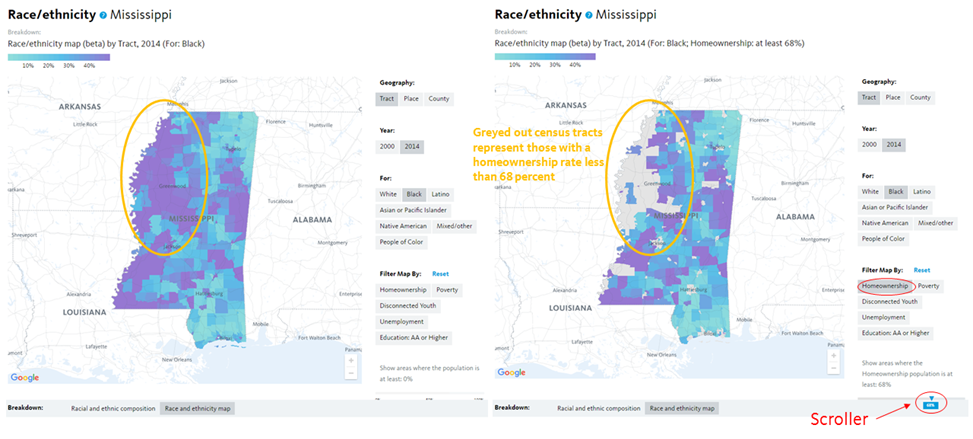
You’ll notice that census tracts are not one of the geography options in the map above. In order to view the data by census tract, you must type in a state, region, or city in the Explore box. After typing in and selecting Mississippi, you get a map of the state by tracts (the default geography at the sub-national level). If you click on “Black”, you get a map of the Black population share. The purple tracts are neighborhoods with a Black population greater than 40 percent. The light blue areas, on the other hand, have a Black population under 10 percent.

To use the filters, first select one, like homeownership, then move the scroller at the bottom to only show areas where the homeownership is at least a given percentage. The overall homeownership rate in Mississippi is 68 percent, but moving the scroller to 68 percent, creates a map of census tracts where the homeownership rate is 68 percent or higher and many of the purple tracts (representing majority Black tracts) in the northwestern part of the state disappear as a result (see maps below). Those tracts that disappear have a homeownership rate less than 68 percent.
Using maps to inform decision-making

These maps can be especially helpful in developing targeted employment or workforce development initiatives. The overall unemployment rate in Mississippi was 10 percent, but this was clearly not the case across all census tracts. Filtering the map by tracts with an unemployment rate of at least 15 percent produces a map with several majority Black tracts. This map can support programs and initiatives through the state workforce investment board by ensuring that resources are targeted to communities that need them most.

Note: While the size (land area) of the census tracts in the state varies widely, each has a roughly similar number of people. A large tract in a more rural part of the state likely contains a similar number of people as a seemingly tiny tract in an urban area. Care should be taken not to pay an unwarranted amount of attention to large tracts just because they are large.

Mississippi has the highest rate of disconnected youth of all states, so understanding how the number and share of disconnected youth varies across the state is central to developing an effective workforce development or education program. To find the map for disconnected youth, select “Disconnected Youth” in Readiness section of the Equity menu. The very last breakdown is the mapping breakdown. As you’ll see in the map below, there are several red census tracts, symbolizing areas where the share of disconnected youth is greater than 20 percent. As you hover over different tracts, you can see both the share and the total number of disconnected youth. In census tract 9504 in Prentiss County, for example, more than 100 young people, or 57 percent of 16 to 19 year olds, were disconnected from both school and work.

The filters and scroller on this map allow you to visualize disconnectedness in relation to neighborhood composition. As you filter to majority White or majority Black neighborhoods, you’ll notice how disconnectedness varies geographically.

For a walk through of the unemployment maps, view our previous blog. For a live walk through of the new maps, register for our webinar. Share your thoughts or questions during the webinar or through our contact form.


The Second Annual p4 Conference Envisions a Just Pittsburgh

The City of Pittsburgh and The Heinz Endowments are spearheading a major effort to forge a new model of urban growth and development that is innovative, inclusive and sustainable.

This model is based around a central, unifying framework — p4: People, Planet, Place, and Performance — and was launched at an international summit in 2015.

p4’s second annual conference will take place on Oct. 18-19, 2016, at Pittsburgh's David L. Lawrence Convention Center. The event will feature a range of national and international experts as well as discussions on all aspects of the p4 framework, and a highlight will be a focus on economic and social equity — the framework’s People strategies — during the second day of the summit.

PolicyLink CEO Angela Glover Blackwell will be a featured speaker on Day One of the summit, speaking on the topic “People – Advancing the Just and Sustainable City.” On Day Two, PolicyLink Senior Director Sarah Treuhaft will be discussing the recommendations of the recently released Equitable Development: The Path to an All-In Pittsburgh.

In advance of the conference, Pittsburgh and The Heinz Endowments have released this powerful new video framing the summit and the issues facing the future of the city:

p4 Pittsburgh 2016

Visit www.p4pittsburgh.org to learn more.

Chart of the Week: #AB1726 in CA Highlights Need for API Subgroup Data

To add equity data to the national dialogue about growth and prosperity, every week the National Equity Atlas team posts a new chart from the Equity Atlas related to current events and issues.

Yesterday, California Governor Jerry Brown signed AB 1726, the Accounting for Health and Education in API Demographics (AHEAD) Act, into law. AB 1726 amends current state code to require the California Department of Public Health to expand the number of Asian and Pacific Islander subgroups for which they collect and report data to also include Bangladeshi, Hmong, Indonesian, Malaysian, Pakistani, Sri Lankan, Taiwanese, Thai, Fijian, and Tongan Americans. The final amendments to the bill removed requirements for public higher education institutions and the Department of Healthcare Services. The University of California and the California State University systems agreed to voluntarily disaggregate Asian and Pacific Islander (API) data, but the California Community Colleges system has yet to signed on.

AB 1726 is a step in the right direction, but all of California’s public higher education and health agencies should report data for more detailed API subgroups, especially because California has the largest and most diverse Asian American, Native Hawaiian, and Other Pacific Islander population.

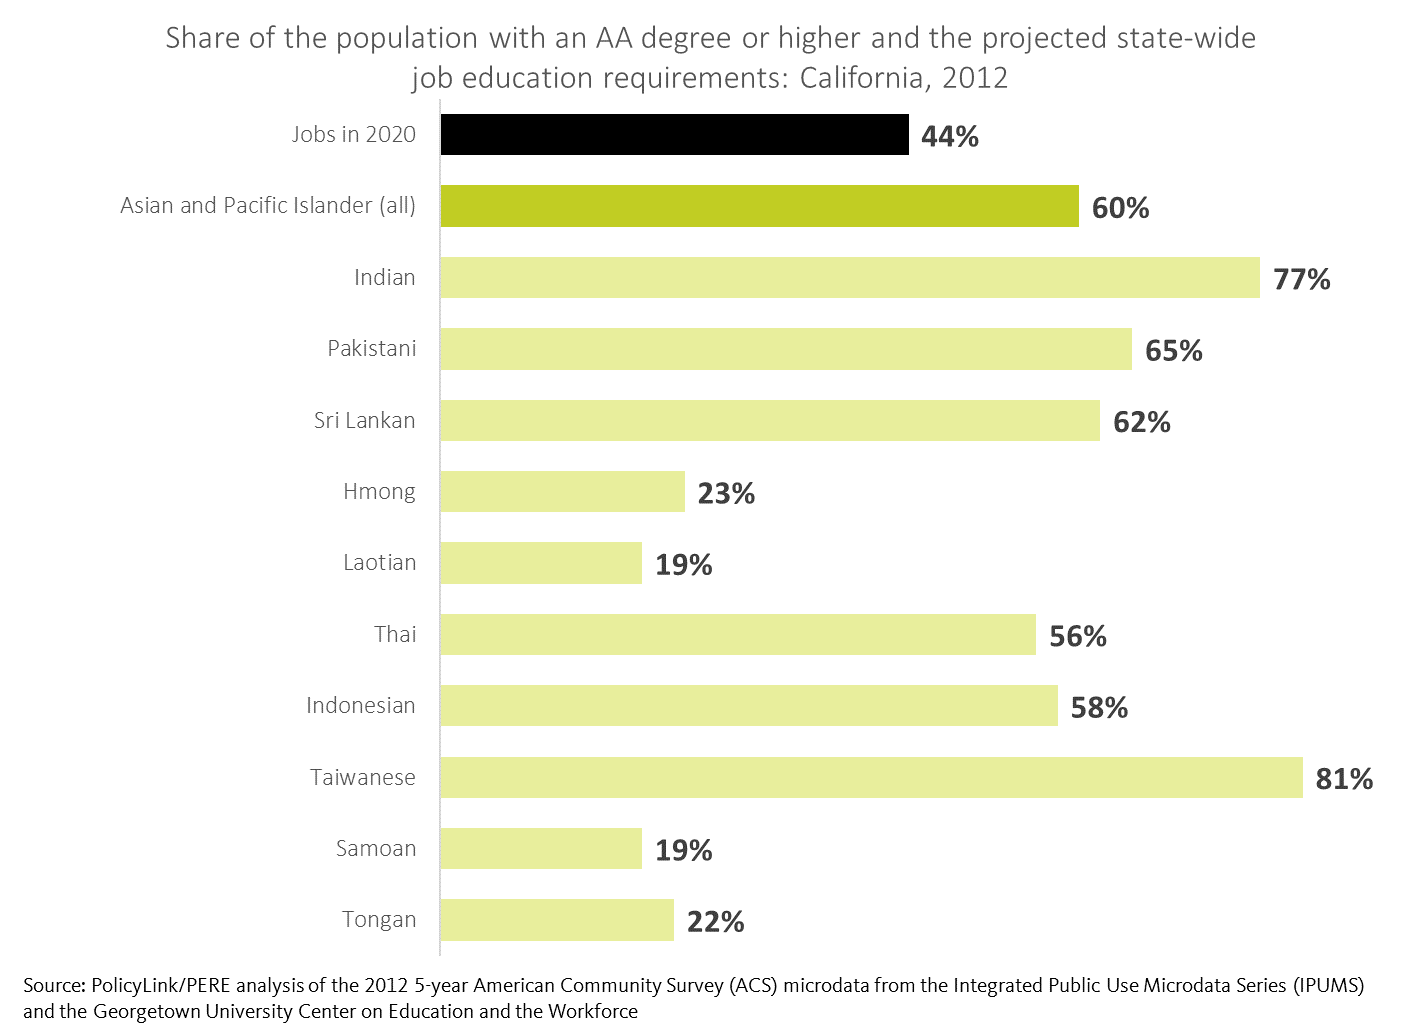
This week's chart highlights the importance of data disaggregation within the API community, particularly when it comes to higher education, by showing the share of the population ages 25 to 64 with an Associate degree (AA) or higher by selected API ancestry groups.

By 2020, a projected 44 percent of jobs in California will require an associate degree or higher. And while 60 percent of the API population as a whole in California has at least an AA, this varies considerably by ancestry. Among Taiwanese people in California, the number is 81 percent, but it drops to 19 percent for Samoans and Laotians. Similarly, Hmong and Tongan Americans have lower levels of education than both African Americans and U.S.-born Latinos. At the other end, Asian Indians and Pakistanis are twice as likely as African Americans and U.S.-born Latinos to have an AA or higher. Less detailed API data can mask barriers faced by certain sub-populations.

For more information about the wide range of outcomes within the API population, check out Asian Americans Advancing Justice’s report A Community of Contrasts: Asian Americans, Native Hawaiians and Pacific Islanders in the West.

To see how educational attainment varies by ancestry in your state or region, explore the education levels and job requirements indicator, type in your state or region in the Explore box, then select the “By ancestry” breakdown. Download the charts and share them on social media using #AllCACounts and #equitydata.

September National Equity Atlas Update

The Atlas is announcing the beta version of a new feature that highlights the equity movement on-the-ground:
 
Preview neighborhood-level mapping added to the Atlas
Today, we released the beta version of new interactive neighborhood-level mapping on the Atlas. These new maps allow users to understand how selected indicators (e.g., unemployment) vary across neighborhoods within a city or region, and can help inform targeted employment and workforce development initiatives as well as infrastructure investments. This beta release features county and census-tract level maps of the unemployment indicator. Register for our special preview of the maps on October 6 specifically for Atlas subscribers and share your feedback ahead of the public release next month.
 
Welcoming America webinar
Welcoming America helps communities across the country achieve prosperity by becoming more welcoming toward immigrants and all residents. On October 7 the National Equity Atlas will be featured in a webinar on eelcoming and economic development. Participants will examine selected economic indicators on the Atlas to get a sense of how immigrants are faring in their communities. Angel Ross, Research Associate at PolicyLink and Justin Scoggins, Data Manager at the USC Program for Environmental and Regional Equity (PERE) are featured speakers. Register here.
 
Forward Community Investments webinar
Last week, the National Equity Atlas kicked off the Forward Community Investments 2016-2017 Racial Equity Webinar Series. The goal of this series is to provide FCI partners with tools and approaches that can be used to advance social, racial, and economic equity and inclusion within their work. The webinar provided an overview of the Atlas framework and a walk through of the Atlas, focusing specifically on Wisconsin.

New Report Makes Case for Equity in Metro Atlanta
A new report from the Partnership for Southern Equity (PSE), Growing the Future: The Case for Economic Inclusion in Metro Atlanta, describes how equity is both a moral and economic imperative for the Atlanta region and for the nation as a whole. The report highlights our full employment analysis and GDP with racial equity analysis, both of which underscore how eliminating racial inequities results in “equity dividends” for the broader economy. See our short post about the report here.

New “Chart of the Week” series
We've launched a new "Chart of the Week" series to add equity data about growth and prosperity to the national dialogue. Every week, we post a new chart drawing from the Equity Atlas related to current events and issues. Our inaugural post lifted up #BlackWomensEqualPay and looked at median wages for Black women in Atlanta, Georgia. We also shared charts highlighting the #Fightfor15, #NoDAPL, and the most recent Census report. Follow our posts on social media using #equitydata, #Fightfor15, and #NoDAPL and in our Data in Action section.

Beyond Affordable Housing: Creating Opportunities in Every Community

Cross-posted from Living Cities: This blog post is part of the Living Cities series “Closing the Racial Gaps: Together We Can” which highlights efforts across the United States that show promise for closing racial opportunity gaps and creating a more equitable future.

Nearly 30 years ago I attended a community development conference focused on replacing decrepit housing in poor, mostly black, inner-city neighborhoods with attractive, affordable dwellings. The leaders in the room saw housing rehabilitation and new construction as the way to revitalize poor communities and improve the lives of the people who lived there. I was uncomfortable with the discussion and began asking: Why would community developers build housing in communities cut off from good schools, jobs, transportation, parks—the resources that people need to thrive and succeed? Is better housing the answer to inequality and injustice?

When I raised these issues, the response was not positive, but more like: “Who let her in?” And it was not just the mostly white community development leaders who pushed back. Black leaders and residents resisted my questioning the efficacy of focusing on rebuilding housing in severely depressed neighborhoods as the way to improve life outcomes. I decided to educate myself more about community development and find a better way to express my concern.

Read the full post on the Living Cities website>>>

Pages