Among the 10 Most Populous Cities, African Americans Remain Underrepresented in Business Ownership

 
Examining data on business diversity and growth for 2007 and 2012, we find large Black/White gaps in business ownership across all the 10 largest cities and declining revenues and wages for Black-owned businesses in most of the cities. San Antonio stands out for having positive performance among Black-owned businesses across all indicators.
 

Removing barriers that prevent people of color from starting and growing successful businesses is a crucial inclusive growth strategy. Entrepreneurship is an important pathway for building wealth and addressing the racial wealth gap, as well as for providing self-employment and income. Entrepreneurs of color also play a major role in creating employment opportunities: research shows that entrepreneurs of color are more likely to hire people of color and locate their firms in communities of color.

While businesses owned by people of color today make up a significant and growing share of businesses in cities across the country, entrepreneurs of color remain underrepresented in business ownership – particularly among high-revenue firms and firms with paid employees. Historic and present-day racial discrimination has contributed to racial inequities in business ownership and growth. The racial wealth gap makes it more difficult for people of color to start a business in the first place, and lack of access to capital adds to the challenge.

To help communities understand how they are doing on racial equity in entrepreneurship, the National Equity Atlas now includes four new indicators of entrepreneurship. These indicators are based on data  from the Census Bureau’s Survey of Business Owners, a twice-a-decade survey designed to paint a picture of all firms — incorporated or not, with and without paid employees — with annual receipts of $1,000 or more by race, ethnicity, and gender. This survey represents the only data source with sufficient sample sizes to examine race and gender equity in entrepreneurship for all the geographies available in the Atlas, including the largest 100 cities. The latest data on the Atlas is from 2012 – after which point the survey was discontinued and is soon to be replaced by the Annual Business Survey.

Using this data, we examined the representativeness and growth rates of Black-owned businesses in the nation’s 10 largest cities (based on 2010 population) from 2007 to 2012. We focused on cities because many policies that foster entrepreneurship, from tax incentives to small business loan programs operate at the city level. We examined how the largest 10 cities measure up when it comes to measures of growth and success for Black-owned business. We focused only on firms with paid employees due to their greater economic impact on local economies.

Uneven Growth in Black-Owned Firms and Labor Force
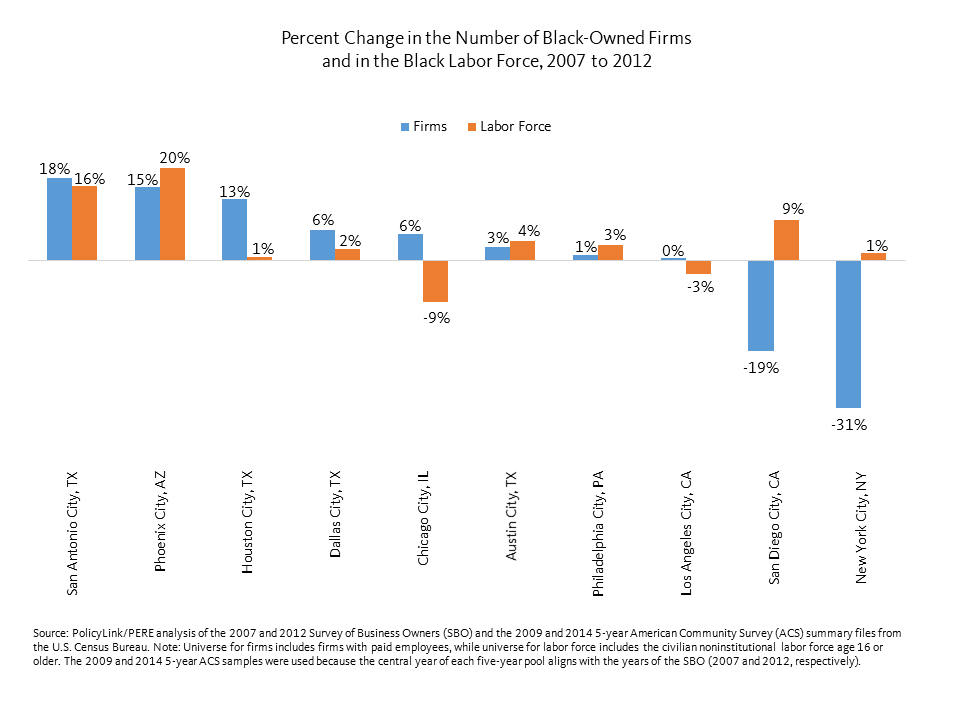
Nationally, the average growth rate for black-owned businesses with employees across the top 100 most populous cities was 19 percent. Across the top 10 cities, growth rates ranged from an increase of 18 percent in San Antonio to a decrease of 31 percent in New York City. Phoenix and Houston also had high growth in Black-owned businesses, while San Diego saw a decline of 19 percent.

Comparing the growth of Black-owned firms with the growth of the Black labor force (a proxy for potential business owners), we see that the two cities with the most firm growth also had the greatest labor force growth; San Antonio and Phoenix experienced growth rates upwards of 10 percent in both Black-owned firms and in the size of Black labor force. In Houston, however, there was strong growth in firms but minimal growth in the Black labor force, indicating a rise in the rate of business ownership. On the other end of the spectrum, New York and San Diego saw rapid declines in the number of Black-owned firms alongside growth in the labor force, suggesting a decline in the rate of business ownership. Overall, the relationship between the two measures is weak, suggesting that growth in Black-owned firms is not simply a function of growth in potential business owners.

Black/White Differences in Business Ownership
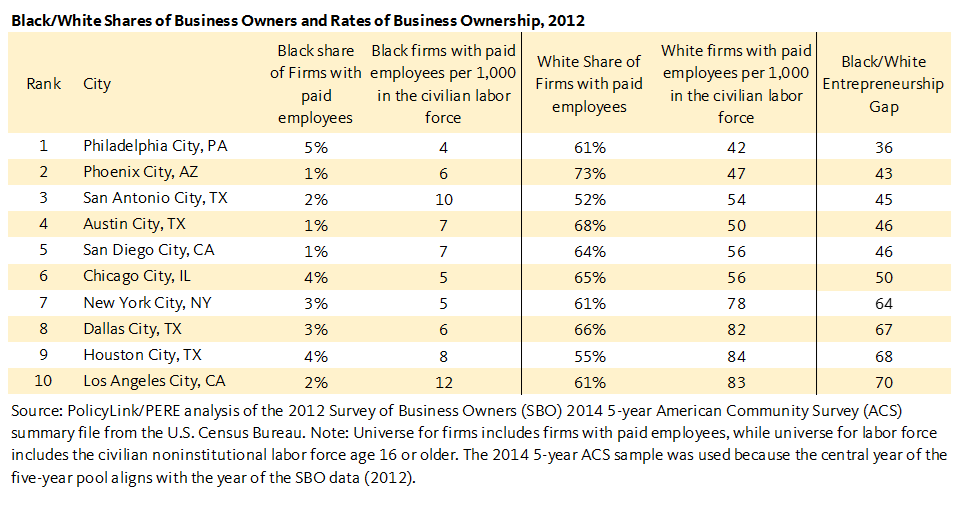
To compare rates of Black and White entrepreneurship across cities, we can look at the number of firms per 1,000 people in the labor force. Examining the 10 largest cities, there is variation in the rates of entrepreneurship in general — that is, rates for both the Black and White populations are relatively higher in Los Angeles and Houston, and relatively lower in Philadelphia and Chicago – but also the rates for the White population are substantially higher than those for the Black population. Los Angeles is the city with the highest number of Black-owned firms with paid employees per 1,000 in the civilian labor force but it also has the largest Black/White entrepreneurship gap at 70 points — meaning that there are 70 more business owners per 1,000 people in the labor force among the White population. This racial gap appears to be driven by the level of White entrepreneurship — influenced by the fact that often White entrepreneurs have more generational wealth and easier access to the financial capital needed to start a business. Philadelphia has the lowest rates of entrepreneurship for both the White and Black populations, along with the smallest entrepreneurship gap of 36 points.

Declining Revenues for Black-owned Firms
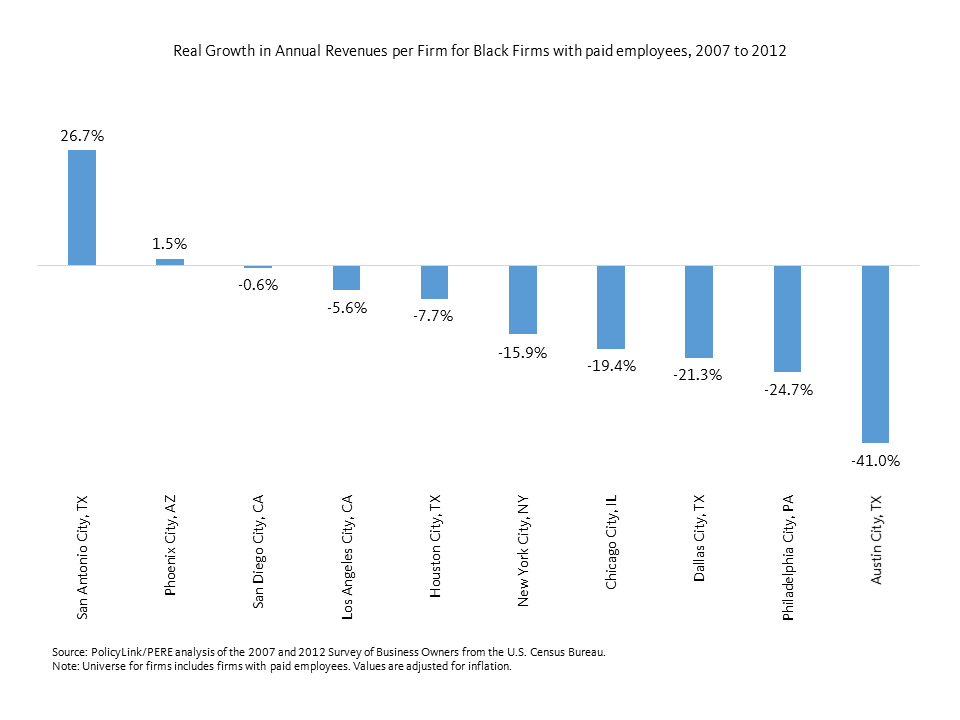
Our most populous cities had mixed success in terms of revenue growth for Black-owned firms, but they declined in eight of the largest 10 cities between 2007 and 2012. The only two cities that saw increases in (inflation-adjusted) revenues per firm for Black-owned firms with paid employees were San Antonio at 26.7 percent (an average increase of about $140,000 per firm) and Phoenix at 1.5 percent (an average increase of about $12,000 per firm). Austin and Philadelphia saw the largest declines in revenues at 41.0 percent and 24.7 percent.

Diverging Growth in Employee Pay Among Black-owned Firms
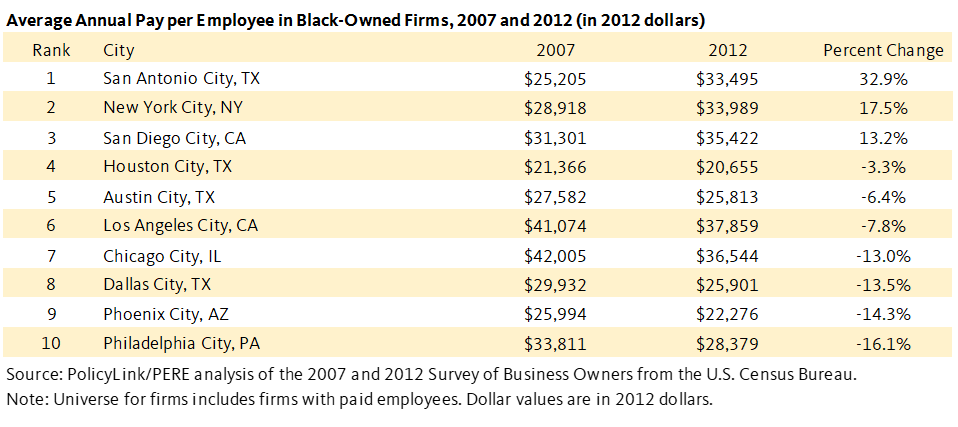
Another important measure of understanding how well Black-owned businesses are doing is whether they are able to increase pay for their workers over time. This is particularly important given that employee pay among Black-owned firms is generally much lower than in other firms, and because Black-owned firms are more likely to hire Black workers, the ability to increase pay can have a positive impact on the racial earnings gap. For a sense of how far behind Black-owned firms are in the wages they are able to provide, the Survey of Business Owners reports average pay per employee for the United States in 2012 of about $37,400 and the average pay per employee for Black-owned firms of only about $28,400.

Looking at inflation-adjusted annual pay per employee for Black-owned firms between 2007 and 2012, we see that annual pay per employee for Black-owned firms only grew in three of the largest 10 cities — San Antonio (32.9 percent ), New York (17.5 percent), and San Diego (13.2 percent). In contrast, Black-owned businesses saw the greatest declines in annual pay per employee in Philadelphia (-16.1 percent), Phoenix (-14.3 percent), Dallas (-13.5 percent), and Chicago (-13.0 percent).

In addition to per employee pay, San Antonio also scored well on other metrics including experiencing the greatest growth in annual sales for Black-owned firms, one of the lowest White/Black Entrepreneurship gaps, and among the largest increases in the number of Black-owned firms and the size of the Black labor force. This diverged from New York and San Diego where annual pay per employee grew despite declines in the labor force. New York was a particularly interesting case because wages grew even while the city had the seventh highest Black/White entrepreneurship gap.

A Need for Equitable Entrepreneurship Strategies

Across the 10 largest cities, there were large racial gaps in Black and White business ownership everywhere, but some cities did show better performance than others. San Antonio showed consistent positive signs for Black-owned businesses on all measures examined: growth in firms, revenues per firm, employee pay, and Black/White gap in entrepreneurship. Meanwhile, New York showed consistent negative signs with the greatest decline in the number of firms, declining revenues per firm, and one of the largest Black/White entrepreneurship gaps.

Certain factors that are associated with increased success in entrepreneurship include wealth, access to capital, and formal and experience-based human capital, which can consist of formal education or experience running family-owned business. Policies and programs that address any of these barriers should help to increase the number of Black business owners and support their long-term success. Finally, incentive programs that lower financial barriers to entry for Black entrepreneurs could help foster business ownership.

To access data on entrepreneurship for your city, region, or state; and to learn more about policies to expand business ownership for entrepreneurs of color, see the four new indicators available in the Atlas: Firm Diversity, Revenues, Business growth, and Revenue growth.
White People, Show Us

Over the past several days we have watched in disgust as the progeny from our nation’s despicable past terrorized a city, committed murder, and received tacit approval from the highest level of government. White supremacy has found a home in the White House. The President is determined to perpetuate and maintain the social, political, historical, and institutional domination by White people at the expense of people of color. And in so doing, he is creating an environment that is also too toxic for White America. The White supremacy movement will not vanish until people of good will succeed in atoning for our nation’s past, reconciling, and building a bridge to a just and fair society where ALL are prospering and reaching their full potential.

America is seeing in real-time what the fight for equity looks like. When cultures, structures, and institutions are forced to change, the responses by those comfortable with and benefiting from the status quo are too frequently ugly, distressing, and violent. Equity leaders should not expect anything less. We signed up for this. Consequently, when things are at their worst, we must be at our best – body, mind, and soul. PolicyLink remains optimistic and single-minded in our work. We are standing strong in the face of formidable opposition because equity leaders, especially those on the front lines, are making progress.

We also are standing strong because we are getting a sense that increasing numbers of White people are sick of other White people's racist conduct. We applaud the fact that from the streets, to corporate board rooms, to charitable giving, White people are taking up the work of equity. We hope we live in a country where most White people do not sympathize with White supremacists. If our perceptions are real, we have an opportunity to accelerate the advancement of equity, and we must seize it. While people of color are going to see this fight for equity through to victory, there is a powerful role that White people must play, and this role can no longer be eschewed for safer, transactional expressions of solidarity.

Show yourselves to be true patriots by joining with people of color, believing in the potency of inclusion, and building from a common bond to stamp out White supremacy and realize the transformative promise of equity – the imperfect and unrealized aspiration embodied in the Constitution. White America, you can perfect this aspiration! To do so requires that you honestly and forthrightly call out racism and oppression, both overt and systemic. And while this is a good start, it is insufficient. Your work is to lead the way in designing and implementing equity-centered public policies, institutional practices, cultural representations, and other norms that trump White supremacy and create a just and fair society. This must be your call to action. This is what people of color need from you.

The normalization of White supremacy must be stopped now before it irreversibly poisons the nation’s culture. Your leadership is critical in this moment. You are best equipped to defeat White supremacy. Here are actions you can take that are transformative.


Show us that our perceptions of a White majority opposed to White supremacy are real. Show us that we have a reason to believe that you will fight with more devotion to create a society that is just and fair for ALL, than White supremacists will in their pursuit to maintain their structural advantage, their racial privilege, their "whiteness." By accepting this invitation, you’re not doing anyone any favors. You’re doing the work necessary to make America all that it can be. History has its eyes on you. Show us. Fight for equity.

With gratitude,

Angela Glover Blackwell
CEO  

Michael McAfee
President

Large Urban Counties are Leading the Nation’s Demographic Change


On November 18, the Large Urban County Caucus (LUCC) of the National Association of Counties convened in New York City, bringing together county leaders from across the country to share ideas and develop innovative policy solutions to address their most pressing challenges.

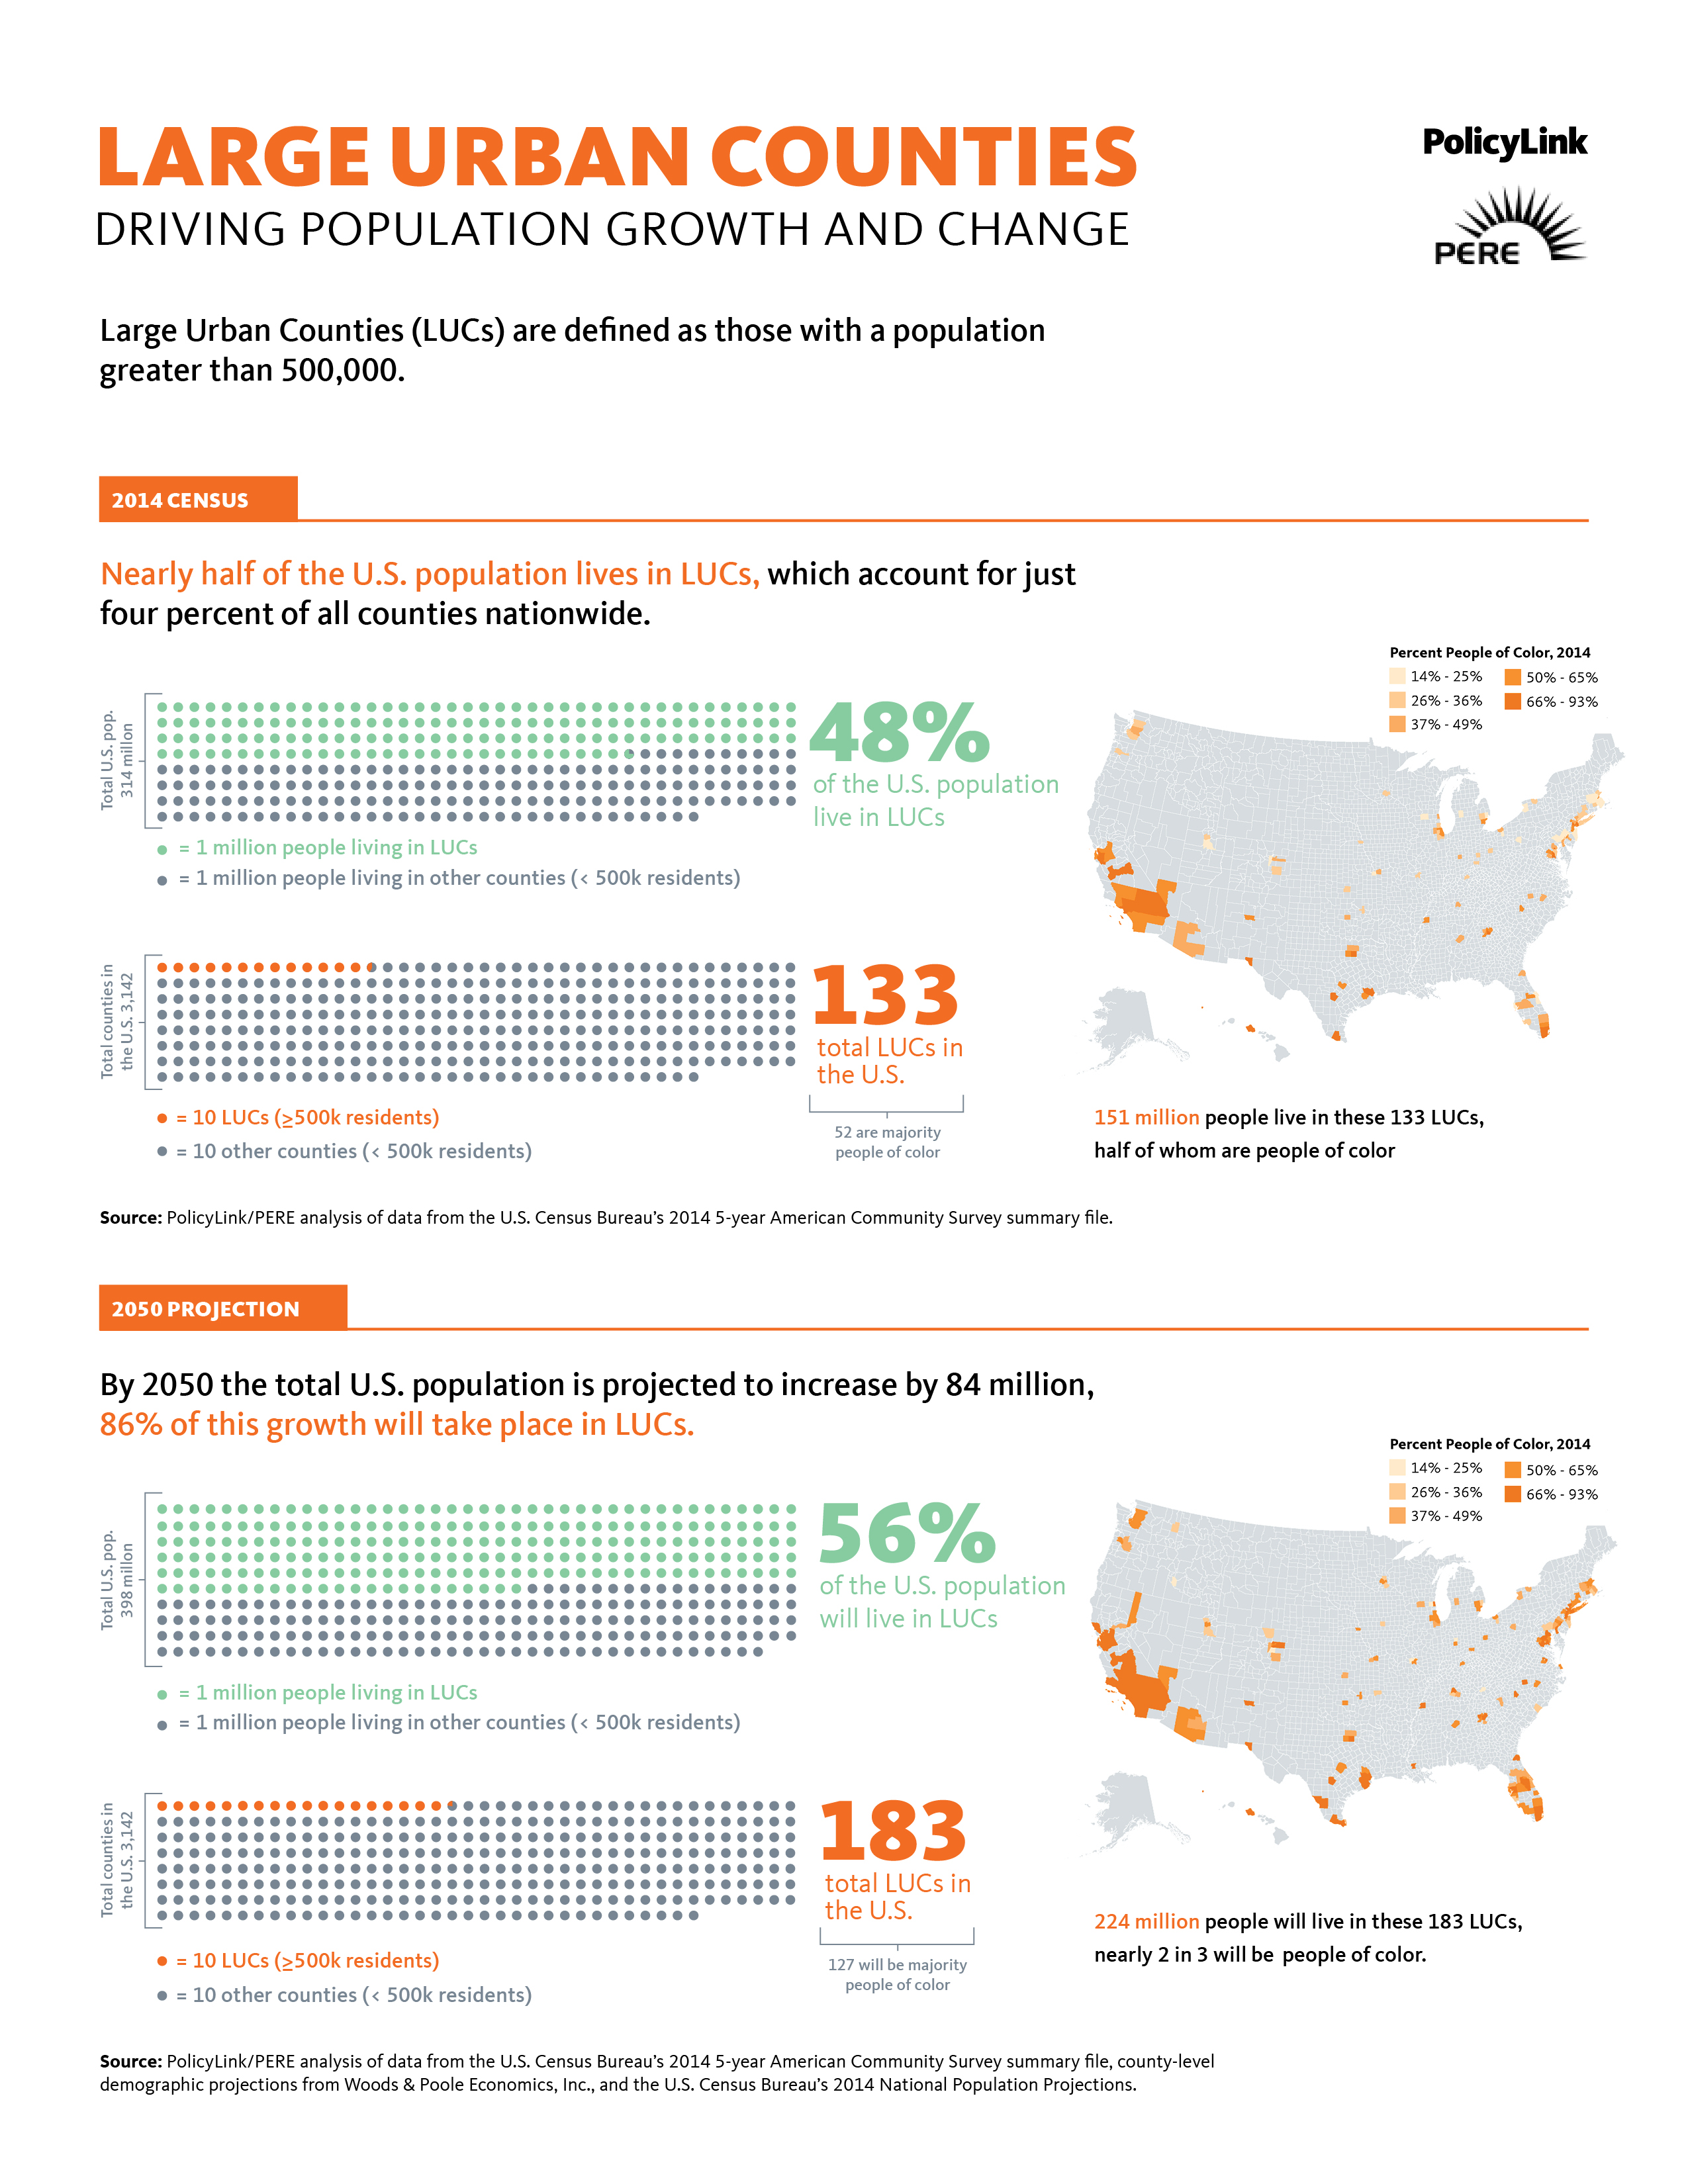
Although they represent just 4 percent of the 3,142 counties in the United States, large urban counties (LUCs) — those with more than 500,000 residents — are home to nearly half of the U.S. population. In other words, as the graphic below illustrates, more than 150 million people live in the 133 LUCs in the United States.

So it is no surprise that these counties are at the forefront of the nation’s shifting demographics. As data in the National Equity Atlas show, the face of America is changing: Just a few years from now, the majority of people under the age of 18 will be youth of color, and by 2044 the United States will be a majority people-of-color nation.

LUCs are already there. The National Equity Atlas team at PolicyLink and PERE analyzed the current and projected demographics of these counties to highlight the economic imperative of equity and inclusion. More than 50 percent of these counties’ residents are people of color, compared to 37 percent of the U.S. as a whole. Today, LUCs are home to 65 percent of people of color in the United States, including nearly 8 out of 10 Asians and Pacific Islanders and 7 out of 10 Latinos.

Over the next few decades, the U.S. population will not only become more diverse, it will also become more urban. Projections show that by 2050 there will be 183 LUCs, and 224 million people will live in them. That is why this year’s LUCC symposium theme, “County Leadership for Economic Opportunity,” is so important: in order to build the vibrant, thriving, inclusive communities of tomorrow, leaders must act today to embed equity into every function of government. Angela Glover Blackwell, chief executive officer of PolicyLink, presented the findings of our demographic analysis, and offered some important guidance for county leaders grappling with the challenges of building an economy in which all can participate and prosper.

LUCs are major economic actors, directing over $350 billion of annual investments in infrastructure, public facilities, health services, economic development, and other critical services and programs. And nowhere else is the economic imperative of equity more clear: by 2050, LUCs will be home to 56 percent of the U.S. population, including 41 percent of Whites and 69 percent of people of color. In her remarks, Blackwell laid out a series of strategies that LUCs can adopt to catalyze equitable growth and provide opportunities for those being left behind to reach their full potential:

  • Prioritize infrastructure investments to improve economic mobility, build career pathways, and create lifelines to opportunity by prioritizing local and targeted hiring and increasing opportunity in disinvested neighborhoods.
  • Align economic development strategies that aim to grow “high-opportunity jobs” with workforce strategies to prepare people to succeed in those jobs. Make equity and inclusion benchmarks a requirement for the allocation of economic development incentives, and hold businesses and developers accountable for delivering on them, through community benefits agreements or other appropriate mechanisms.
  • Integrate and health and human services into development, investing in the residents and workers as well as the built environment of neighborhoods. Remove barriers to preventive services to improve and safeguard the health of tomorrow’s leaders, innovators, and workers.
  • Ensure that jobs related to the construction and operation of public facilities are good jobs that providing family-supporting wages, health care and other benefits, paid sick leave, and opportunities for professional development.


By leveraging their considerable assets to foster economic inclusion, create healthy communities of opportunity, and champion justice and safety for all, large urban counties can play a decisive leadership role in building equitable regions in which all can participate, prosper, and reach their full potential.


Latinos See the Highest Increases and Levels of Working Poverty in Many Regions


As Latinos drive population growth and change in America, their ability to thrive is increasingly critical to the health of our economies locally and nationally. Yet, new data on working poverty in the National Equity Atlas reveals the extent to which many Latinos are working full-time yet still struggling economically. In 2012, nearly one in three Latino full-time workers, ages 25 to 64, earned below 200 percent of poverty – up from 27 percent in 1990 and compared with 9 percent for their White counterparts.

This post takes a closer look at Latino working poverty across the nation’s largest 150 metropolitan regions. Working poverty describes full-time workers with a family income below 200 percent of poverty, and the rates of working poverty in this post reflect the working poor as a share of full-time workers ages 25 through 64. While poverty is defined at the family level, based on combined income from all family members, in this post we make reference to individual earnings for simplicity. Given that an individual’s family income must be as high or higher than their personal earnings, the rates of working poverty reported here understate the rates that would be found if only an individual’s earnings were considered.

Latino Working Poverty High and Increasing in Many Regions

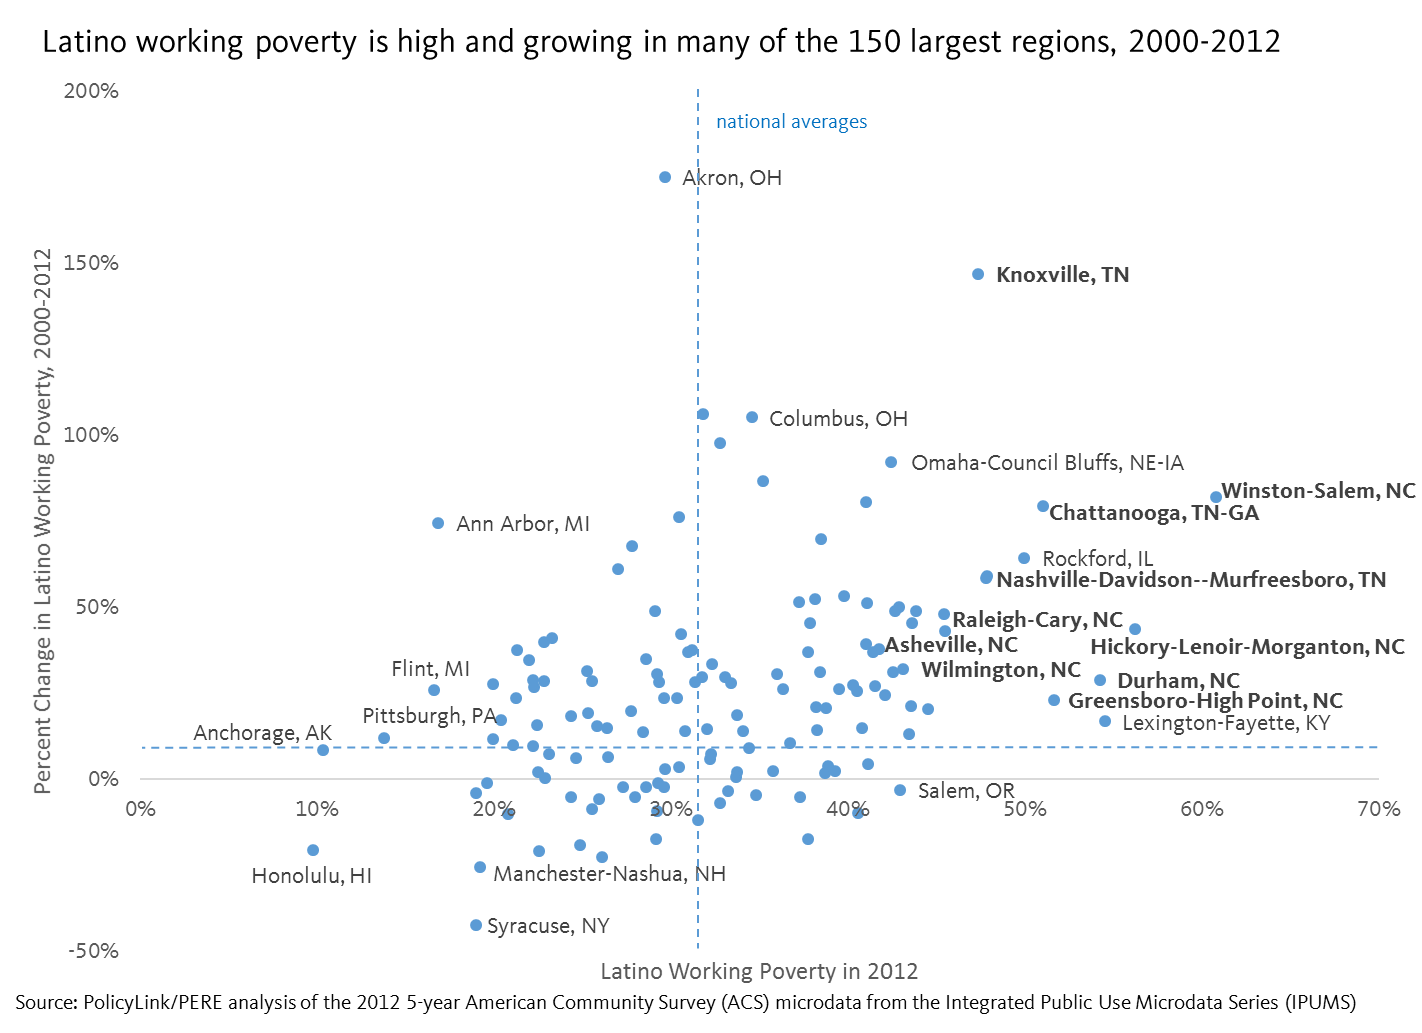
Not only do many regions have high rates of Latino working poor, conditions are getting worse over time. This is shown by the scatter plot below, which plots the largest 150 regions by the share of Latino full-time workers who earn below 200 percent of poverty in 2012 and the percent increase in Latino working poverty between 2000 and 2012. The farther to the right, the greater the share of Latino working poverty in 2012. The higher up on the chart, the greater the percent increase in Latino working poverty between 2000 and 2012. As illustrated by the number of metros in the upper-right quadrant, there appears to be a positive relationship: the regions with higher rates of working poverty among Latinos also saw a sharp growth in Latino working poverty.

Regions in Tennessee and North Carolina have the highest rates of Latino working poverty
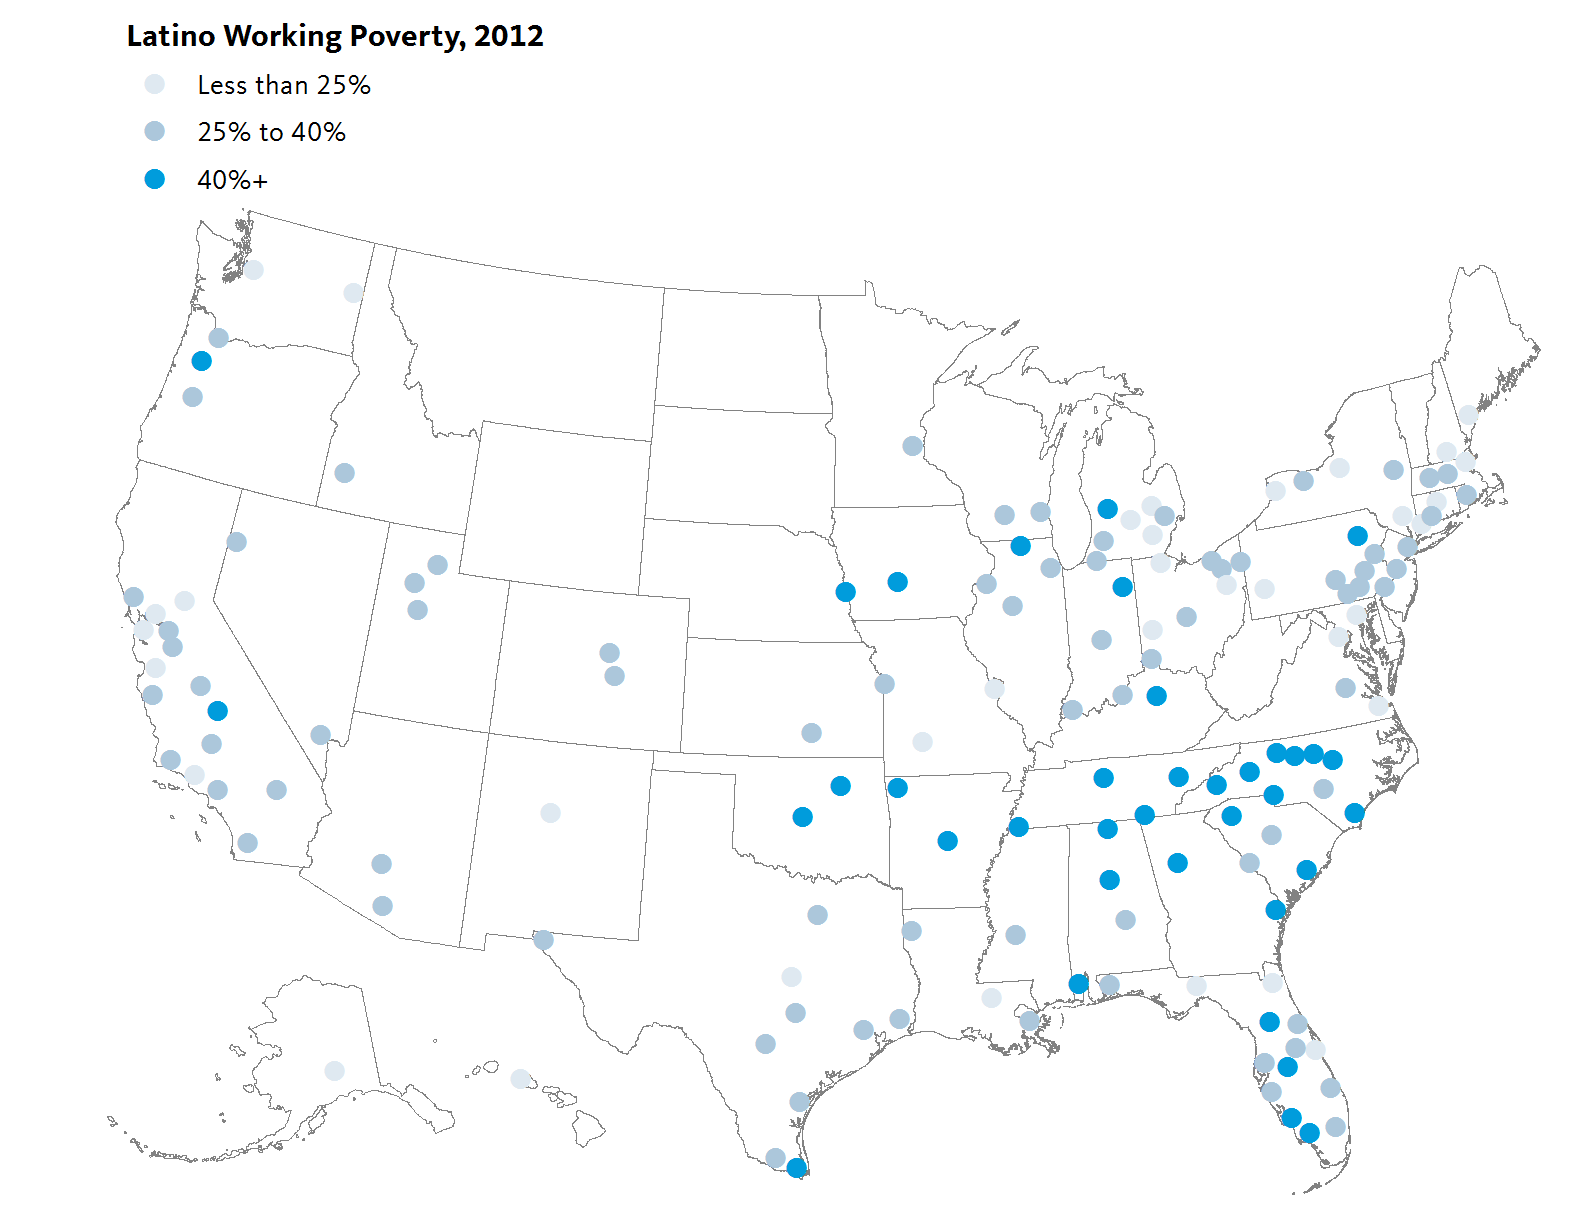
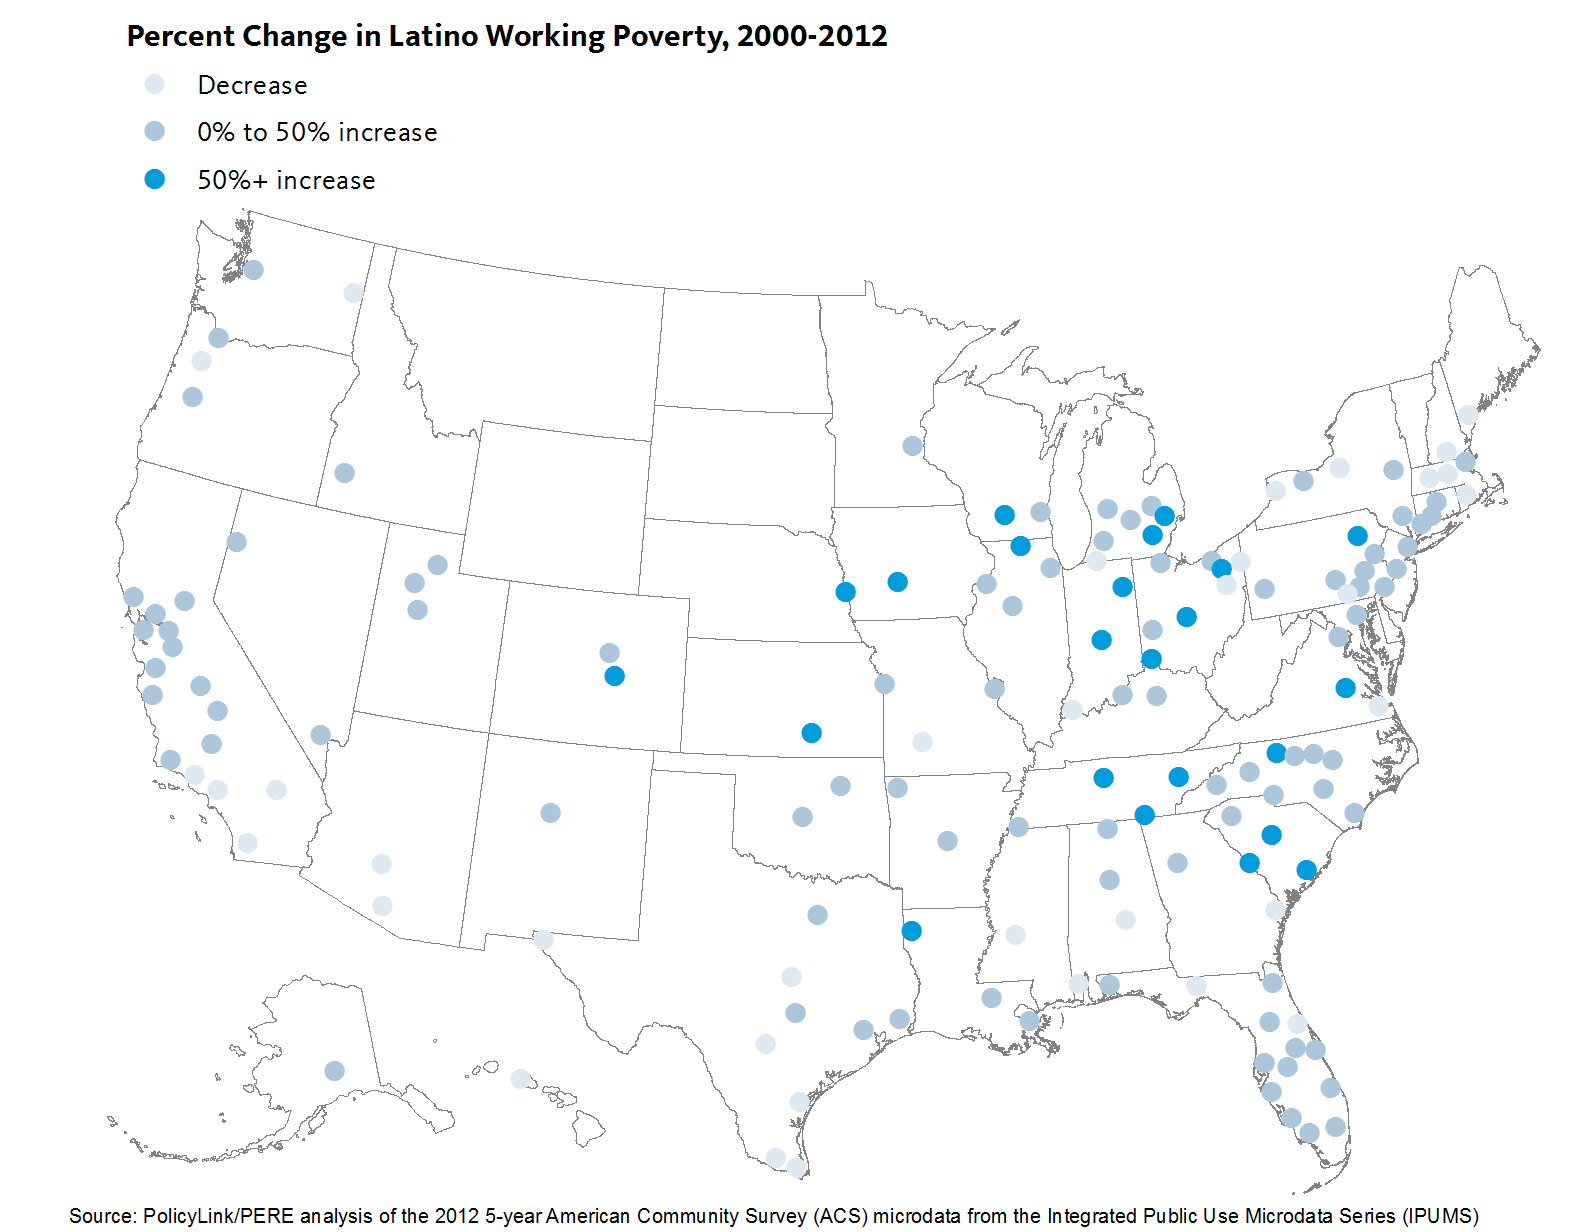
Mapping the data reveals additional geographic patterns, including the clustering of Latino working poverty in the South and particularly in the states of Tennessee and North Carolina. Of the largest 150 metro regions in the U.S., all nine in North Carolina saw substantial increases in working poverty among Latino full-time workers, ranging from a 23 percent increase in Greensboro to an 82 percent increase in Winston-Salem. Each region also had a Latino working poverty rate greater than the national average except for Fayetteville, which matched it. More than half of Latino full-time workers in Greensboro, Durham, Hickory, and Winston-Salem earned less than 200 percent of poverty.

Similarly, the four regions in Tennessee included in the Atlas saw higher than average increases in the overall rates of Latino working poverty. One in two Latino full-time workers in Chattanooga earned less than 200 percent of poverty in 2012, up from 28 percent in 2000. Over the same time period, the Latino population grew significantly faster than any other group in the region.

Tennessee and North Carolina are among the roughly 15 states that currently ban local governments from adopting their own minimum wage laws. Part of the controversial HB2 law passed earlier this year in North Carolina, which restricts usage of multiple occupancy bathrooms for transgender and gender non-conforming people, also includes state preemptions to local minimum wage increases. The current minimum wage in Tennessee and North Carolina is the same as the federal: $7.25 an hour. The MIT Living Wage Calculator, however, estimates that a living wage for a family of four ranges from $13 to $22 an hour in Tennessee and from $14 to $23 an hour in North Carolina. The state preemption laws also prevent localities from allowing workers to earn paid sick leave.

This is a growing and alarming trend: eight states have considered restrictions on local minimum wage increases this year and the story is often similar. When states fail to pass increases in minimum wages in step with increases in cost of living and inflation, some jurisdictions take matters into their own hands by increasing local minimum wages. State legislatures—especially those led by Republicans—push back by adopting laws preventing local action. Raising wages would be especially beneficial to workers of color. In North Carolina, for example, 11 percent of White full-time workers earn less than 200 percent of poverty compared with nearly half of Latino full-time workers. Even more striking, 12 percent of Latino full-time workers earn less than 100 percent of poverty.

Addressing working poverty is a moral and economic imperative. If Latinos, the fastest growing group in many regions, are unable to participate, prosper, and reach their full potential, the impacts will go far beyond the Latino population. To learn more about working poverty in your city, region, or state, and learn about policies that lift the wages of workers, explore the new working poor indicator.

New Data Highlights Vast and Persistent Racial Inequities in Who Experiences Poverty in America

Already the majority of children under five years old in the United States are children of color. By the end of this decade, the majority of people under 18 years old will be of color, and by 2044, our nation will be majority people of color. This growing diversity is an asset, but only if everyone is able to access the opportunities they need to thrive. Poverty is a tremendous barrier to economic and social inclusion and new data added to the National Equity Atlas highlights the vast and persistent racial inequities in who experiences poverty in America.

On June 28, we added a poverty indicator to the Atlas, including breakdowns at three thresholds: 100 percent, 150 percent, and 200 percent of the federal poverty line. We also added an age breakdown to the new poverty indicator, in response to user requests for child poverty data, which allows you to look at poverty rates across different age groups including the population under 5 and 18 years old as well as those 18 to 24, 25 to 64, and 65 and over.

Why examine different levels of poverty? In 2012, the federal poverty level was less than $12,000 for a single person and roughly $23,000 for a family of four with two adults. Many believe that this is too low. The National Center for Children in Poverty argues, for example, that families need an income at least double the federal poverty level to meet basic needs. Another critique relates to the varying costs of living across communities. $23,000 will go much further in a lower-cost region like McAllen, TX compared with a high-cost one like San Francisco or Washington, DC. To understand the broader universe of families experiencing economic insecurity, this analysis focuses mainly on the population below 200 percent of poverty.

 People of color have the highest rates of economic insecurity, while Whites saw largest increase since 2000

Looking at how the share of people living at or below 200 percent of poverty has changed since 1980, we see a few trends. First, economic insecurity (defined in this way) decreased for all racial/ethnic groups except Latinos, who saw an increase of two percentage points over the three decades. During the same time period, Latinos went from just 6 percent of the population to 16 percent and were the fastest growing population over the last decade. In other words, the same demographic group driving growth and change is increasingly experiencing economic insecurity.

Second, the largest overall increases in economic insecurity over the past three decades in the U.S. occurred between 2000 and 2012. During that period, rates increased for all groups except Asian and Pacific Islanders (APIs). Interestingly, Whites have seen the largest increase in economic insecurity since 2000 despite having the lowest rate by far of all major racial groups.

Third, while there are large racial inequities in who experiences economic insecurity, it is a widespread challenge that affects all racial/ethnic groups including Whites. Half of people of color live below 200 percent of poverty compared with only a quarter of Whites but that does not mean Whites are immune to poverty – that percentage represents nearly half of the total U.S. population below 200 percent of poverty.

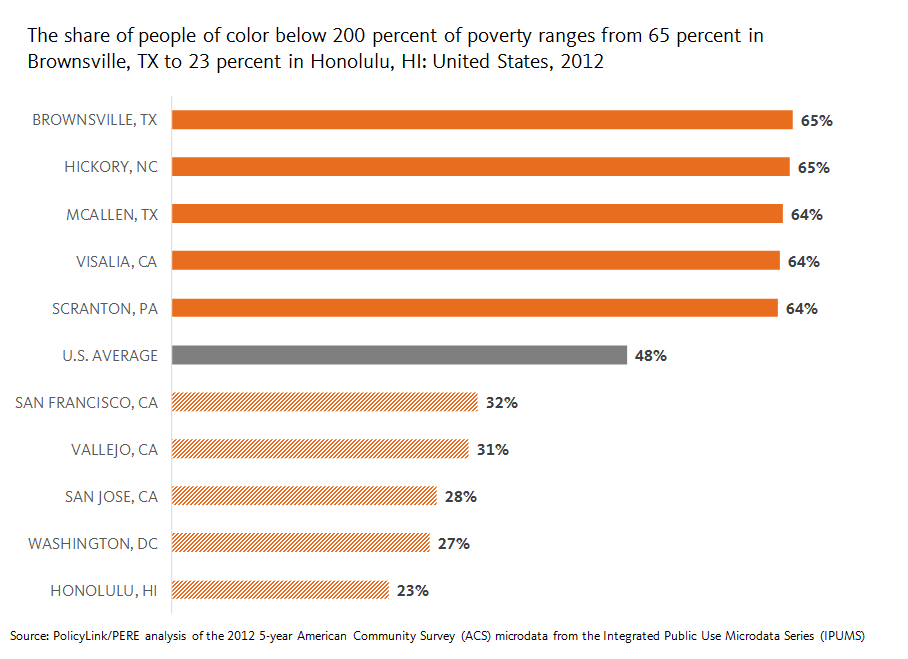
The share of people of color experiencing economic insecurity ranges from less than a quarter of people of color in Honolulu to nearly two in three people of color in Brownsville, TX

While nationally just under half of all people of color fall below 200 percent of poverty, local percentages vary considerably across metropolitan regions, from 65 percent in Brownsville, TX to 23 percent in Honolulu. In order to understand these numbers, it is important to consider the local cost of living, since poverty rates are universal, while costs of living vary tremendously by region. We can do that by looking at “regional price parities" (or RPPs). Calculated by the U.S. Department of Commerce Bureau of Economic Analysis, RPPs indicate relative differences in the cost of goods and services across states and metropolitan areas.  They are expressed as a percentage of the average national price level, and range from the highest cost region, Honolulu, at 123 down to McAllen, TX, the lowest cost region in the Atlas, at 84.9.

In general, places with the highest rates of economic insecurity also tend to have lower costs of living: Four out of the five regions with the largest shares of people of color living at or below 200 percent of poverty fall within the bottom third of the 150 largest U.S. metros with the lowest cost of living. And the five regions with the lowest shares of people of color below 200 percent of poverty fall within the 10 most expensive metros in the Atlas. But an affordable rent under this poverty threshold would be less than $1,150 a month for a family of four—which would be nearly impossible to find in these higher cost regions.

The demographic makeup of the regions with the largest shares of people of color experiencing economic insecurity are at both ends of the spectrum: Hickory and Scranton are much whiter than the U.S. as a whole while Brownsville, McAllen, and Visalia are much browner. But they all have one thing in common: people of color are projected to drive the vast majority of population growth over the next couple decades while the White population is expected to decline.

Communities of color are actually the fastest growing segments of the population in most regions, including those with majority White populations, but they continue to face barriers to educational and economic opportunities, stifling their own potential, the potential of the regions where they live, and that of the country as a whole.

Black and Native American children most likely to experience poverty

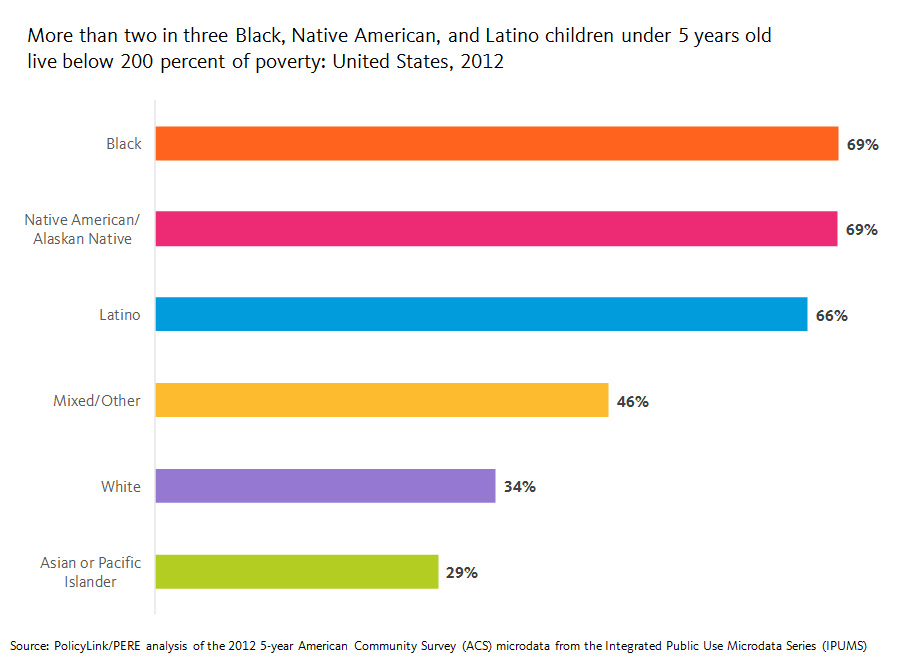
When looking at the population under 18 years old, roughly 63 percent of Black and Native American youth live below 200 percent of poverty compared with 31 percent of White and API youth. Children of color are nearly twice as likely as White children to be economically insecure. Even more alarming is that the share of kids under 5 years old, who are already predominately children of color, is even higher. More than two in three Black, Native American, and Latino children under five years old live below 200 percent of poverty. Given what we know about the adverse effects of child poverty, it is alarming that the two largest groups of kids of color, Latinos and Blacks, have the highest poverty rates.

The implications of these findings are far-reaching. Not only will the children of today become the workers of tomorrow, who will be expected to support the growing retired population, but child poverty is also estimated to cost the U.S. economy $500 billion a year, underscoring the importance of racial equity for enduring prosperity. Explore poverty in your city, region, or state here. For more data highlighting the gap between the aging white population and the growing population of youth of color, see the racial generation gap indicator.

Counting a Diverse Nation — Disaggregating Racial/Ethnic Data to Advance Health Equity

How we measure America's rapidly expanding diversity has critical implications for the health of the nation. Too often, the data used to drive policymaking, allocate resources, and combat health disparities is based on broad racial and ethnic categories that can render the unique needs, strengths, and life experiences of many communities invisible.

That is why PolicyLink is excited to release Counting a Diverse Nation: Disaggregating Data on Race and Ethnicity to Advance a Culture of Health, a multifaceted investigation that explores the leading issues and opportunities of racial/ethnic data disaggregation, and its implications for advancing health equity. The report provides a comprehensive assessment of racial and ethnic data disaggregation practices today, and concrete recommendations for improving research methods and promoting government policies that enhance and enable data disaggregation in the future.

READ THE FULL REPORT AND RELATED MATERIALS

Findings and recommendations in the report encompass two areas:

  • Best practices for collecting and analyzing data about race and ethnicity at more detailed levels, including research innovations and special considerations for studying marginalized populations;
  • Government policies and practices that can enhance and enable data disaggregation, including recent campaigns and policy wins across the nation that are supporting increased representation across racial, ethnic, and cultural identities.

Developed as part of a multiphase project commissioned by the Robert Wood Johnson Foundation, the report reflects two years of collaborative research and input among a diverse set of experts, demographers, practitioners, decision makers, and advocates. Reviews by these researchers of the state of data disaggregation for each major U.S. population group, along with a comparative study of seven other countries, accompany the new report

To learn more about the critical importance of disaggregating racial/ethnic data from researchers, advocates, and other experts who contributed to this report, listen to the archived webinar.

    Take Action: Oppose the Citizenship Question on the 2020 Census

    The question about citizenship proposed for the 2020 Census by Commerce Secretary Wilbur Ross would create enormous problems and result in a systematic undercount in lower income communities of color that would significantly undercut fair political representation, allocation of federal funds, and our basic understanding of who lives in the United States.

    Electoral districts for all Congressional, state, and local offices would be biased for a decade, and the needs and eligibility of key population groups for federal resources would be underestimated, at a point when major demographic changes are underway across the country. Recent evidence has shown that the plan for the citizenship question was not an earnest effort to help enforce the voting rights but just the opposite: a deliberate strategy to politicize and undermine the accuracy of the Census. The lawsuits brought by human rights and civil right advocates and state governments are an important defense against the citizenship question, but the government also needs to hear from all of us!

    The Commerce Department is taking public comments through August 7, and the Census Counts campaign has created an online portal through which everyone can easily submit their views. Please take a moment today to join PolicyLink and hundreds of other organizations in defense of a fair Census that counts everyone. For further information, see PolicyLink Vice President Victor Rubin’s blog post, which includes many useful resources.

    There’s No Need for A Citizenship Question in the Next Census

    The announcement by U.S. Secretary of Commerce Wilbur Ross that the 2020 Census will agree to the Justice Department’s request and add a question about citizenship is wrong on so many levels that it’s hard to track them all.  The Constitutionally-mandated responsibility of the decennial census is to count all residents, regardless of citizenship, and actions that would interfere with doing that as thoroughly as possible undercut that grave responsibility. 

    A question about citizenship would discourage participation in the Census and lead to systematic undercounting of residents and an incomplete, biased picture of who lives in the United States. The consequences of such an undercount would be dire, skewing political representation and the allocation of federal funds. The undercount would affect immigrant communities of color in particular. For example, as the First Focus Campaign for Children put it, “For Hispanic children, the problem of being undercounted is exacerbated by a recent decision from the Department of Commerce to add a question on citizenship in the 2020 census. Coupling this announcement with aggressive and cruel immigration enforcement tactics currently being undertaken by the Trump administration, the expectation becomes a dramatically reduced participation rate from immigrant and mixed status families who fear the negative repercussions of revealing their immigration status.”

    Advocates for an accurate, complete, and fair Census are used to raising their voices to push for more resources to be devoted to outreach, not to warding off bad, inflammatory proposals. But in reacting swiftly to this misguided and cynical step, they have the facts, the Constitution, and the nonpartisan importance of unbiased data on their side. There is no need for a citizenship question in the decadal Census to enforce the Voting Rights Act, as the Justice Department has claimed. There is great risk in adding an untested question at this late stage, jeopardizing years of preparation. We support the lawsuits being filed by several states and other parties and the movement to push Congress to reverse this plan. 

    For further information about these efforts, see the following sources:


    Advancing Economic Inclusion in Southern Cities


    In 2015, the Annie E. Casey Foundation, in partnership with PolicyLink, launched Southern Cities for Economic Inclusion, a cohort of seven cities dedicated to advancing economic equity for low-income communities and communities of color. Comprised of city officials and staff, local philanthropy, and business and community partners from Atlanta, Asheville, Charlotte, Memphis, Nashville, New Orleans and Richmond, the group convenes regularly to share best practices and learn from experts. Their next meeting will be in Richmond from October 23-25.

    This group explicitly identifies and addresses the unique historical, political, and legal obstacles to achieving economic inclusion in the South; namely, the region’s deeply entrenched legacy of racism and segregation, as well as the structural limitations imposed by state laws that strip cities of the authority to advance economic inclusion policies such as local hiring or inclusive procurement.

    Leaders from the seven cities are advancing real solutions by:

    • Establishing an economic agenda that both acknowledges and confronts the legacy of race. City and community leaders in New Orleans and Atlanta have created economic opportunity plans that set a proactive agenda to invest in people of color and others who have been left behind and demonstrate how equity will lead to everyone being better off.  
       
    • Bringing together diverse stakeholders to advance an economic inclusion agenda. In Memphis, Nashville, and elsewhere, anchor institutions such as universities and medical facilities, along with business and other leaders in the private sector, are coming together with city partners to encourage growth in the minority business community and bring new investments into communities without causing displacement. 
       
    • Innovating policies and programs to support minority-owned businesses and connect people to jobs. In Charlotte, Richmond, and Asheville, cities have developed pilot procurement programs and incentives to support minority businesses and to help connect individuals with barriers to employment to good jobs.
       

    These projects and initiatives are changing the cultural silence on race in economic development policy and strengthening local positions despite state restrictions on local authority. We applaud these city leaders for their work thus far.  Reaching this point has required creativity in policy design, political deftness, and most of all, resilience.  However, advancing this work will require additional investment and strong partnerships across a wide range of stakeholders, including local and national philanthropy, the private sector, and community-based organizations. We hope you will join us to advance an economically inclusive and prosperous South.

    We Are All Dreamers

    Turning our backs on young Americans who arrived in this country with family or other adults seeking a better life is morally reprehensible. The Trump Administration’s decision to eliminate the Deferred Action for Childhood Arrivals (DACA) program places over 800,000 young people at risk of deportation and separation from their loved ones and reneges on a promise made to those young people by our government.

    Yesterday’s action underscores the Administration's pursuit of normalizing racist and xenophobic beliefs through an agenda rooted in the criminalization of people of color. Igniting polarization by race and ethnicity and scapegoating our immigrant brothers and sisters threatens the culture, economy, and security of our nation. Again, we must stand up for the latest target of this hate-filled Administration whose efforts to splinter the nation for the benefit of a cruel minority have no end. We are all DACA children.  

    Ending DACA is morally wrong and economically foolish.  For years, PolicyLink has argued that Equity is a moral imperative and the Superior Growth Model.  The diversity of this country is critical to its economic growth and prosperity.  The actions against DACA will negatively impact the economy in ways underscored by recent studies revealing a loss of billions from the national GDP over the next decade and the loss of contributions from thousands of valuable workers and entrepreneurs.   

    Young people covered by the DACA program must be protected and the nation’s promise honored.  Now more than ever, we need Congress to act quickly and confirm that Americans of every race and creed are valued, that our government keeps its promises and rejects hate and xenophobia, and that the U.S. is a place that welcomes all who come sharing a democratic vision and valuing freedom, justice, and equity for all.   

    Here are a few things you can do to demonstrate your support:  

    1. Call your members of Congress and demand their support for the Dream Act. And, with DACA ending, it's time for Congress to pass a clean version of the bipartisan Dream Act. Use dreamacttoolkit.org to call and urge your member of Congress to stand up for Dreamers.  
    2. Attend a rally: You can locate rallies in your area using Resistance Near Me.   
    3. Show your support online: Raise your voice to support the #DreamAct by tweeting and posting your support for young immigrants. Make it clear that they are #HereToStay. Find sample tweets & hashtags below.

    Sample Tweets:

    • Trump decision on #DACA is morally wrong & economically unwise. Congress must stand up 4 young immigrants & America. Protect immigrants now!
       
    • Will Congress pass the Dream Act, which creates a path to citizenship for Dreamers, without using their loved ones as bargaining chips? 1/2
    • Or will they stand idly by and let the president destroy the lives and livelihoods of immigrants? #HeretoStay 2/2
       
    • 800,000+ dreamers are in our workforce. Ending DACA not only disrupts their lives but also their employers, coworkers, patients & more.
       
    • Trump's decision against Dreamers is not the end for immigrants. Congress must do right by them: pass the Dream Act. #HeretoStay
       
    • @HouseGOP @SenateGOP have a choice: side w/ 800,000+ young immigrants and protect them... or uphold Trump's hate agenda? #HeretoStay
       
    • @realDonaldTrump has stripped legal status of young immigrants who make America strong. Congress must right this wrong: pass #DreamAct!
       

    Pages