All-In Cities: Building Momentum in Pittsburgh, New Orleans, Detroit, and Indianapolis


As America’s cities experience a comeback, city leaders need to implement bold strategies to ensure no one is left behind or displaced. All should have the opportunity to contribute to building new urban economies that are equitable, sustainable, and prosperous. Through the All-In Cities initiative, PolicyLink empowers city officials, community advocates, and other civic leaders with the policy ideas, data, and hands-on assistance to make racial economic inclusion and equitable growth their reality. We’ve had an exciting week full of milestones:

Pittsburgh: Equitable Development

Today, more than one hundred community leaders gathered at the August Wilson Center in Pittsburgh for the release of Equitable Development: The Path to an All-In Pittsburgh, produced in partnership with Neighborhood Allies and Urban Innovation21. Mayor William Peduto, City Council Member Daniel Lavelle, and other leaders from government, business, and the nonprofit sector discussed the recommendations. Follow the conversation on social media at #AllInPittsburgh

Indianapolis: Equitable Innovation Economies

Since 2014, New York, Indianapolis, Portland and San Jose have been piloting new approaches to advancing equity in innovation and manufacturing through the Equitable Innovation Economies Initiative, a multi-year project led by the Pratt Center for Community Development in collaboration with PolicyLink and the Urban Manufacturing Alliance (UMA). Yesterday at the UMA national convening in Indianapolis, we released a new report, Prototyping Equity: Local strategies for a more inclusive innovation economydocumenting the groundbreaking efforts of these cities. Join the conversation at #proequity.

New Orleans: #EquityNewOrleans

PolicyLink is advising the city of New Orleans in the development of its citywide equity strategy. On Tuesday, September 13, the city held its second community listening session to discuss how the city can integrate racial equity throughout its activities. Learn about the initiative at www.equityneworleans.org and participate at #EquityNewOrleans
 

Detroit: New Economy Initiative Impact 

On Wednesday, September 14, the New Economy Initiative released a report highlighting its impact. Since 2007, the unique funder collaborative has helped build an inclusive entrepreneurial ecosystem in Detroit, providing direct support to over 4,400 companies, helping launch more than 1,600 new companies (39 percent of them owned by people of color and 32 percent by women), and creating more than 17,000 jobs. PolicyLink has advised the initiative on its equity strategy since 2009.

Learn more about our All-In Cities initiative and sign up for updates at www.allincities.org.


Using the 2015 DataHaven Community Wellbeing Survey to Understand Neighborhood Equity and Unify Cross-Sector Partners

Twenty-eight percent of adults who identify as non-Hispanic white in Connecticut report that they experience high blood pressure, compared to twenty-two percent of adults who identify as Latino, according to DataHaven’s 2015 Community Wellbeing Survey. This statistic suggests that for this health measure, Latinos fare better than their white counterparts.

However, the median age of white adults is more than a decade higher than the median age for Latinos in Connecticut. If you examine age-specific rates comparing whites and Latinos within the same age groups, Latinos experience high blood pressure at significantly higher rates.
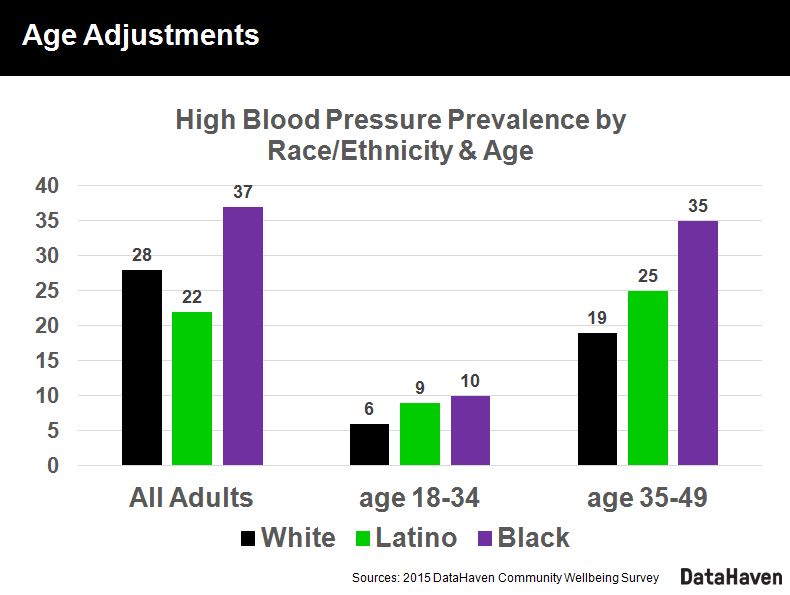
 

This is just one example of the importance of breaking down data by age, race and ethnicity, neighborhood, income, and other factors. By providing community profiles, crosstabs, and public reports of the data collected from its Community Wellbeing Survey as well as other sources, DataHaven and its partners aim to emphasize why examining local data at multiple levels is necessary to making accurate, informed policy decisions that improve well-being and overall quality of life.

Well-being measurement as a unifier
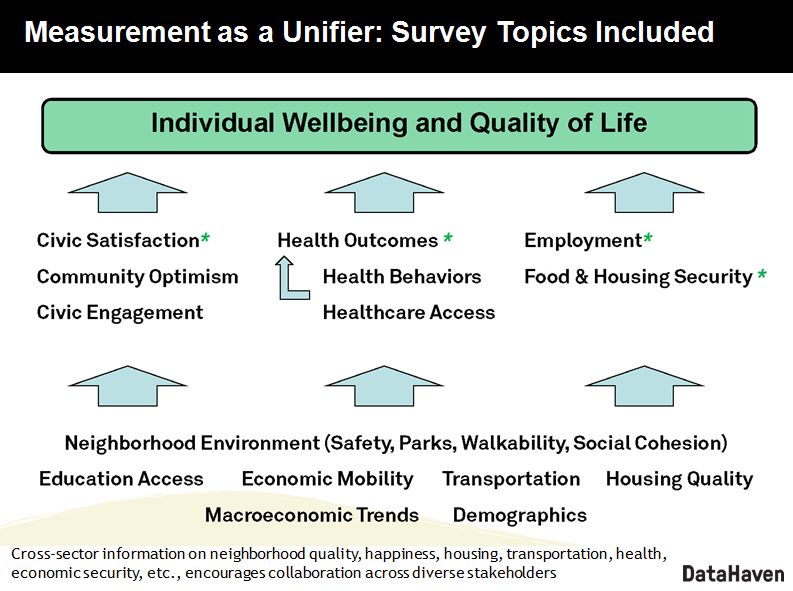
The DataHaven survey supports organizations working across different issue sectors, allowing them to understand how issues such as employment, financial stress, health, transportation, and neighborhood quality are related to one another. 

To facilitate this, the survey includes a series of questions designed to measure happiness, physical and mental health, and life satisfaction – also known as experienced and evaluative well-being – that were based on well-known international surveys. 

These desired “well-being outcomes” are presumably shared by all people working to improve quality of life within an area; measuring them is a way to show how such efforts are interconnected as well as helping to reveal some of the largest barriers to individual well-being. 

According to our analyses, some of the barriers that stand out include a lack of social or community support, inability to afford needed health care, under-employment, and food insecurity.

According to Anita Chandra, Director of RAND Infrastructure, Justice, and Environment, one of the advisors on the development of the survey, the DataHaven Community Wellbeing Survey “gives you a picture on how residents are doing across the state and in neighborhoods specifically, which can help community leaders plan. It really provides a holistic understanding of quality of life, which we know matters, not only in the immediate but over the long term. Capturing things like how do people perceive their community, how do they relate to each other, in addition to economic indicators that are more traditional, really gives us a better sense of not only individual well-being but community well-being, and that is important for ongoing policy and program development.”

Developing a statewide, cross-sector survey on neighborhood well-being

One goal of the DataHaven Community Wellbeing Survey is to develop robust information on individual- and neighborhood-level well-being that was previously unavailable at the local or even state level.  More than 16,000 randomly-selected residents throughout Connecticut participated in in-depth cell phone and landline interviews, providing local partners with information on a range of issues that in many cases can be disaggregated at the local level.

In planning the survey, we were inspired by words of Angela Glover Blackwell, the CEO of PolicyLink, who said at a 2014 OECD/Ford Foundation event, “if you want to achieve an equitable outcome, it starts with disaggregated data. We need to have the courage to look within ourselves and see who is, and who isn't, doing well."

The survey program grows out of a need to unify data collection on social and economic issues throughout Connecticut.  DataHaven and a panel of survey research experts began by considering results from more than a dozen local-level surveys conducted throughout Connecticut in recent years, including others by DataHaven, as well as dozens of national surveys. Based on previous studies done elsewhere in the US and significant input from local and national experts, DataHaven developed the questionnaire to serve as a uniform tool for a variety of organizations.

This survey was made possible through the direct support of more than 50 partner organizations and funders, including community foundations, non-profit hospitals, colleges and universities, local public health departments, and other state or regional agencies. Adult participants were recruited by landline and cell phone, and then participated in live interviews in English and Spanish with staff of the Siena College Research Institute. Data was weighted to represent populations in each area, and sample sizes were scaled to match populations in large, midsize, and small cities and towns with all 169 towns included.

Breaking down the data by neighborhood and demographic group

There are differences in median income or health status across counties, but these differences are much more striking when comparing zip codes or neighborhoods within the state’s urban centers and wealthier towns. The survey results highlight the need for better disaggregation of data at a local level, where we see much of the variation occur.
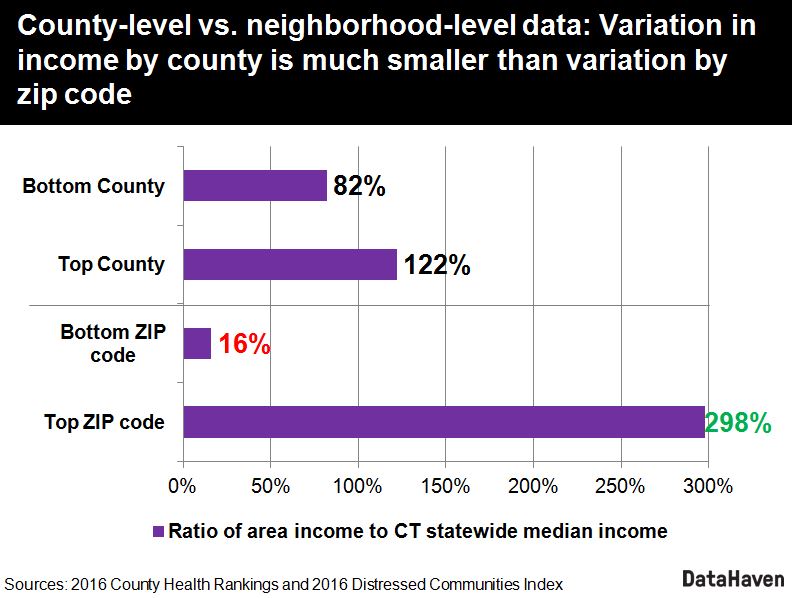
Since the survey was designed to look at neighborhoods, we prioritized neighborhood-level questions on community resilience – such as about the environment surrounding people’s homes. Assets like sidewalks, safe neighborhoods, stores, and parks were among the questions that we felt were important. Survey responses confirmed the importance of these assets – with walkability scales varying widely across different types of built environments.

Additionally, we often expect to see differences in well-being across income level. For example, higher income residents are more likely to report that their neighborhood is a good place to raise children. However, the survey allows us to dig deeper and include the effects of neighborhoods themselves.

Splitting this question on age-friendliness by zip codes’ distress levels, we see that neighborhood conditions are a much better predictor of a participant’s answer to this question than their income.  Residents in the state’s highly-distressed zip codes, which are primarily in the city centers of Bridgeport, Waterbury, and Hartford, have similar answers regardless of their household income.
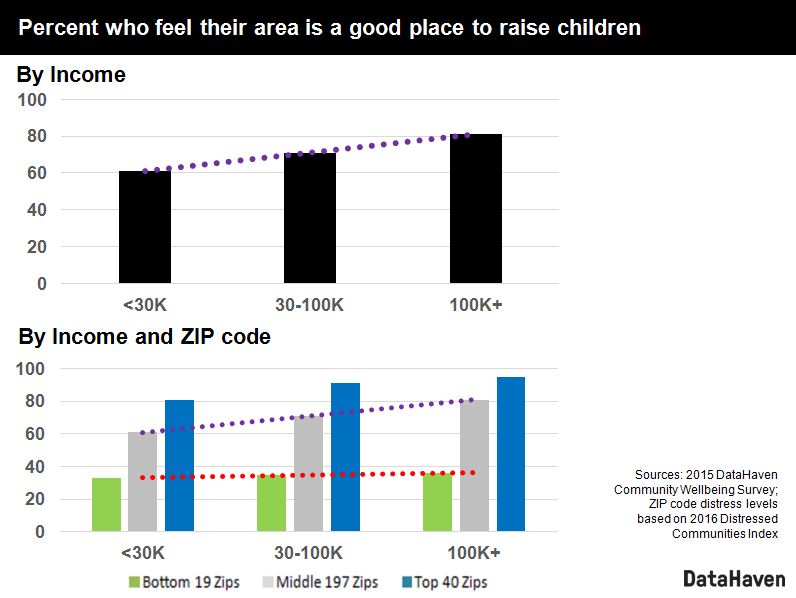
This speaks to the importance of disaggregating data at a neighborhood level, especially to understand community context and plan appropriate interventions.

We also see differences when disaggregating by both race/ethnicity and age, as previously mentioned. This is particularly important because the median age of white residents is more than a decade older than that of Latino residents. Calculating differences across age groups is essential to producing a valid picture of community well-being.

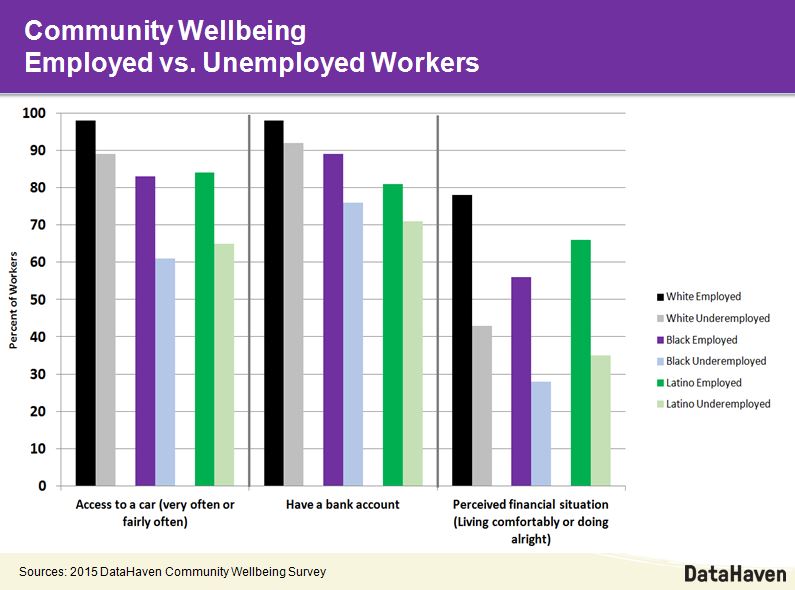
Similarly, we get a more complete picture of both personal and community well-being when we split participants into groups like food insecure versus secure; employed, unemployed, and underemployed; or commute time. For many questions, these groupings—in combination with other demographic factors—tell us much more than income level alone.
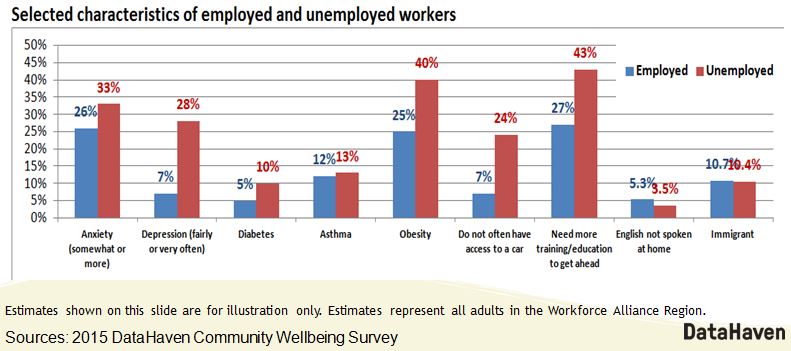
With some of these alternative groupings, we can identify differences in access to resources, such as cars, banking, and internet access, that may help organizations and policymakers better understand and target residents’ needs or justify changes in policies that support families.
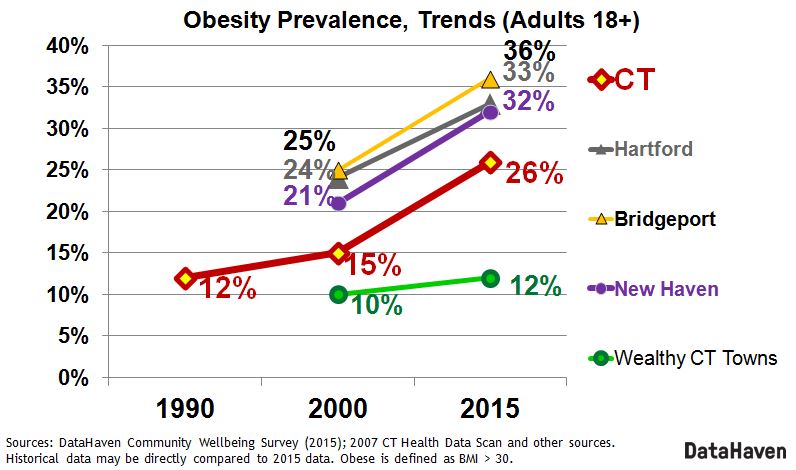
Using consistent questions in multiple survey efforts allows us to measure changes over time as well. For example, obesity prevalence has increased statewide since 1990, but at different rates based on location. Obesity rates stayed steady in wealthy towns, while rising sharply in other parts of the state.  
Looking at trends over time within regions, we see wealthier towns are also less likely to smoke regularly. Similarly, while rates of adults lacking health insurance have gone down statewide, we still see rates are high within areas with large populations of immigrants.
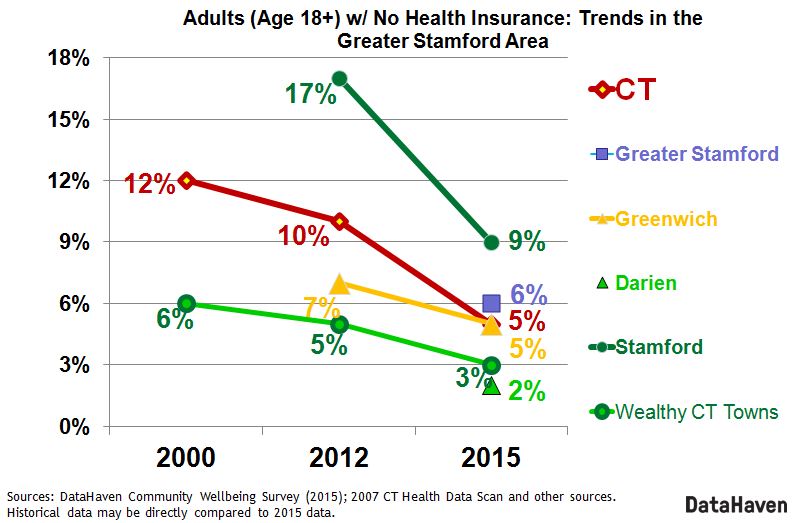
We also found differences by location within regions and cities. We compared measures between neighborhoods in large cities, and in some cases mapped data by zip code. Within all regions throughout the state, we found stark differences in a series of health care measures when comparing low-income residents to high-income residents.

Residents in wealthy towns are more likely to have positive opinions on health-promoting community resources, such as the conditions of parks, access to services, and neighborhood safety.  At the same time, the survey shows that the most distressed neighborhoods also contain many assets that support community resilience, including walkable sidewalks, bike lanes, cultural activities, and involved neighbors.

Accessing survey resources

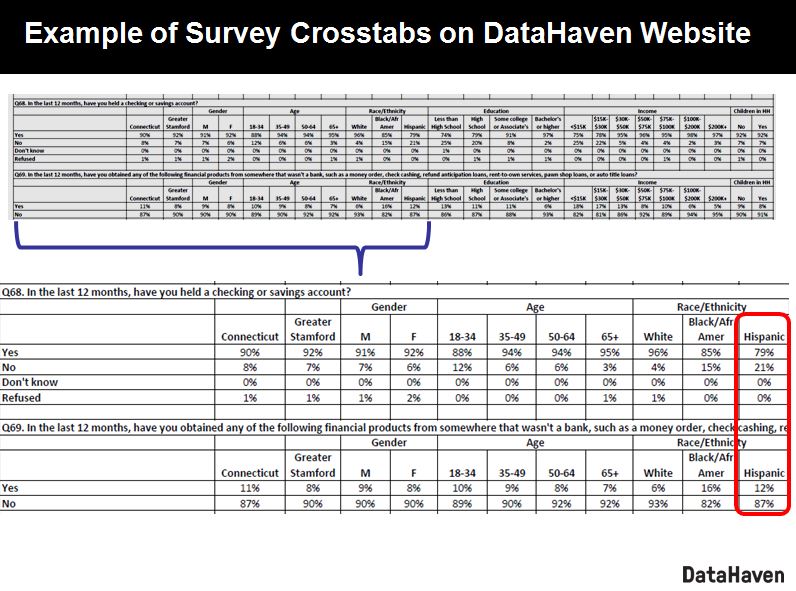
On our website, we host resources such as reports and survey crosstabs; we also have developed community profiles for towns and neighborhoods. In the crosstabs, we make available regional and town-level estimates for every question broken down by demographic groups, income, and education, along with guidance for using the tables. Other organizations throughout Connecticut and beyond are making extensive use of the data, and may contact us with any questions.
By working closely with dozens of other organizations throughout Connecticut, we are releasing reports and neighborhood tools based on the survey data and other state and federal data sources.  These include several of our own comprehensive community indicator reports focused on the Fairfield County and Greater New Haven areas, that will serve a double purpose as Community Health Needs Assessments for non-profit hospitals and health departments in these regions.  We are also building partnerships with media organizations and universities, and providing ongoing technical assistance to non-profit organizations and government agencies throughout the state. We encourage other organizations to use or build upon the survey to better understand local communities’ trends and needs.

DataHaven encourages interested parties to reach out to suggest topics or questions that should be included in the future. We were cautious on this survey to not duplicate other efforts; but designed it in a way that would complement other sources of information that already exist.

A webinar with more information on the DataHaven Community Wellbeing Survey is available on the Public Health Foundation’s TRAIN national website, made possible with a grant from The Robert Wood Johnson Foundation and funding from participating states and the Centers for Disease Control and Prevention.
The Role of Public Policy in Alleviating Poverty

(Cross-posted from the Stanford Social Innovation Review)

In this recording from the recent Frontiers of Social Innovation conference, Angela Glover Blackwell (PolicyLink Founder and CEO) talks about why, for United States to grow and prosper, policymakers must adopt new approaches to produce good jobs, ensure reinvestment in low-income communities, upgrade the education and skills of an increasingly diverse workforce, and create opportunities for everyone to apply their talents. She also shows how equity, inclusion, and fairness are no longer just moral issues but also economic imperatives: Equity is the superior growth model.

Click here to listen to the recording.

Gender and Racial Pay Gaps Stifle Local and Regional Economies

Cross-posted from the Toronto Star

Though they make up nearly half of the workforce in the U.S. and Canada, women — and women of colour in particular — continue to be marginalized in labor markets. Women make significantly less than men of similar experience and education, are vastly overrepresented in low-wage work, and are underrepresented in management — these are not just civil rights issues, they are fundamental failures within the labor market that are holding back economic growth for cities, regions, and entire nations.

When my mother, a young journalist, moved us from her home town of Montreal to New Jersey in the early 1950s, soon after I was born, she was looking for relatively better opportunities to advance in her profession as a woman, and the grass at least appeared to be greener in the States at the time. It did not necessarily turn out to be the case, and both countries still have a long way to go, but there are also promising changes in attitudes and concrete policy steps being taken on both sides of the border, as the imperative for justice intersects in new ways with strong economic incentives for inclusion and fairness.

Urban and regional economies -- in both the public and private sector — have a stake in seeing gender and racial pay gaps decline. As a group, women in the U.S. and Canada are more educated than their male peers and they are the fastest growing demographic of entrepreneurs, with women of colour leading the growth in small-business ownership in the U.S. This, in part, is why many local leaders are doubling down on efforts to address inequities in the workplace, seeking to capitalize on the often underappreciated talent and potential that women in the workforce bring to the table. For example, under the leadership of former Mayor Thomas Menino, Boston sought to become the “premier city for working women”, and current Mayor Marty Walsh recently pledged to become the first U.S. city to eliminate the gender pay gap entirely. Boston is home to the largest proportion of young women between age 20 and 34 — and the highest percentage of college educated women — of any major U.S. city, making the economic opportunity of its young women top priority for local leaders. To close the remaining 18-cent pay gap in the city, Mayor Walsh is leading the charge to educate businesses on the economic importance of closing the gender pay gap. One particular business-focused effort, 100% Talent, is a first-of-its-kind initiative that has enlisted 100 companies to voluntarily pledge to help close the gender gap by sharing payroll data (including metrics on gender and race), implementing recommended practices to reduce pay inequities, and participating in biennial reviews to discuss their progress. The Mayor has also spearheaded a $1.5 million project called Work Smart in Boston, which will provide 90,000 women with salary and benefits negotiation training over the next 5 years.

On the opposite coast, in a city home to the largest gender pay gap among major U.S. cities -- local government in Seattle, Washington is taking inspiration from Boston’s example. After a 2013 analysis found that women in the Seattle metropolitan area were earning 73 percent of what men make, with women of colour earning anywhere from 49 to 60 percent, then-Mayor McGinn’s office convened the City of Seattle’s Gender Equity in Pay Task Force, which has led the city to pass a resolution in 2014 calling on several cities departments, including the Personnel Department, Seattle Office of Civil Rights, and the Mayor’s Office, to promote progressive policies in hiring, pay, and benefits that specifically target both gender and racial inequities. Within the private sector, the city’s Chamber of Commerce and the Women’s Funding Alliance launched their own 100% Talent in 2015 whereby businesses will be obligated to identify internal gender equity issues, share lessons learned with other employers, and implement at least three of the 33 best practices identified by the initiative, including flexible scheduling, greater wage transparency, and increased diversity in hiring practices.

Though these efforts are still in their early stages, these leaders are proving that they understand the crucial opportunity facing cities and regions today: the places that will thrive the most in the 21st century economy will be those that embrace inclusion and capitalize on the talent, creativity, and potential of all residents — especially those who have too often been left behind. This dedication to inclusion is at the heart of All-In Cities — an initiative to promote inclusion and equitable growth in cities launched this year by my organization, PolicyLink.

Like the recommendations made by the 100% Talent initiatives above, All-In Cities seeks to support policymakers and businesses within metropolitan areas to foster comprehensive economic and racial inclusion. For gender and racial inequality in the workplace, this means looking beyond the pay gap to the very structure of the labor market — asking not only, how can we lift stifled wages for women, but how can we build work environments that are conducive to the needs of the ever-growing segment of female workers and their families.

In addition to reevaluating wage, hiring, and scheduling practices as mentioned above, this means policymakers and businesses should foster female entrepreneurship and leadership within organizations. They should promote women’s education and recruitment within high-paying fields — such as math, science, and technology — where they are historically underrepresented. Employers should offer paid family leave and sick leave, so that working mothers do not have to choose between a paycheck and taking care of a sick child.

Overcoming an issue as stubborn as the pay gap will require widespread cultural shifts — in classrooms, in boardrooms, in local councils and halls of parliament —but the rewards we will reap in justice and prosperity are well worth the effort. Advocates for equality from an earlier time, like my mother, would have appreciated how much the ground has shifted.

Read the full article in the Toronto Star (page 2).

Power Your Advocacy with New Equity Data

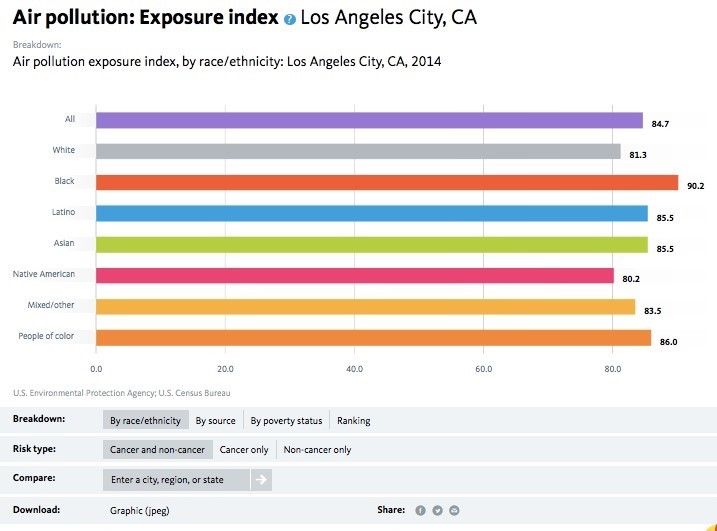
Clean air and high-quality schools are fundamental elements of “communities of opportunity” that allow residents to thrive. Last week, the National Equity Atlas, produced jointly by PolicyLink and the USC Program for Environmental and Regional Equity (PERE), added three new opportunity indicators to equip local leaders with relevant data to build equitable cities and regions:


The National Equity Atlas team was proud to participate in the “The Opportunity Project,” an Open Opportunity Data event held yesterday at the White House where the new Atlas indicators were showcased. The White House effort focuses on facilitating the development of a suite of digital tools that puts neighborhood-level information on access to opportunity at the fingertips of families, community organizers, non-profits, local leaders, and the media.
 
Writing in a letter to the editor published in the New York Times, on March 7, PolicyLink President and CEO Angela Glover Blackwell noted the importance of disaggregating data by race and ethnicity is critical to understanding trends and developing solutions: “Recognizing this ‘people’ dimension of poor neighborhoods — and the complex interplay of race and place — is essential for catalyzing equitable and sustainable economic prosperity for all.”
 
School Poverty Data Highlighted in The Atlantic
The Atlantic is already demonstrating the analytical power of this new data. Abigail Langston and Sarah Treuhaft from PolicyLink are quoted in “The Concentration of Poverty in American Schools,” by Janie Boschma and Ronald Brownstein, who note that in about half of the nation’s largest 100 cities, most Black and Latino students go to schools where at least 75 percent of all students qualify as poor or low-income:
 
“Kids who spend more than half of their childhood in poverty have a high-school graduation rate of 68 percent,” said Abigail Langston, a senior associate at PolicyLink, and a public fellow at the American Council of Learned Societies. “You see how these things compound over time. There is a link between housing policy, economic and racial segregation, you see what those do to schools and to people who grow up in those neighborhoods.”
 
In the article, promising school integration models from Dallas and New York City are lifted up as tools to address these gaps. The Atlantic also uses the National Equity Atlas’s school poverty indicator in the stories “Separate and Still Unequal” and “Where Children Rarely Escape Poverty.”
 
Join upcoming Equitable Development and Environmental Justice Webinar
On Friday, March 11 the EPA’s Office of Environmental Justice will conduct the free webinar “New Data Tools for Supporting Analysis of Equitable Development and Environmental Justice.” Sarah Treuhaft, who is PolicyLink director of equitable growth initiatives will present the new air pollution indicators in the National Equity Atlas. The webinar will also feature a demo of the new environmental justice screening and mapping tool. Register here

Equity Speaks: A conversation with Steve Phillips and Angela Glover Blackwell

The dramatic growth of communities of color has laid the foundation for a new progressive American majority with the potential to transform the nation’s politics, policies, and economy, says author, lawyer, and political activist Steve Phillips.

The key is for progressive leaders to recognize and respond to this extraordinary moment in history. But for the most part, they have not, Phillips argues in his new book, Brown Is the New White. Drawing on extensive demographic and electoral data, Phillips shows why it’s mathematically wrong and politically perilous to chase White swing voters by toning down a progressive message. Rather, progressives will win elections by fielding candidates who have strong roots in communities of color; talk forthrightly about issues of race; and embrace an agenda focused on equity, economic inclusion, and opportunity for all. Phillips spoke with PolicyLink President and CEO Angela Glover Blackwell.

Listen to the extended interview below:

Read an excerpt of the interview below:

Angela Glover Blackwell: At PolicyLink, we’ve been saying for a while that with shifting demographics, getting the economic agenda right for people of color is going to get it right for the nation — that equity is the superior growth model. Your book reinforces this. Describe the political opportunity and the economic opportunity you see in this moment in America.

Steve Phillips: For a long time, the assumption around what policy should be and who it should target has been constrained by fears of the role of the conservative/moderate White swing voters. Throughout history, there have been progressive White leaders who tried to move forward a more equitable agenda but they always tempered it — from Thomas Jefferson trying to include references to slavery in the Declaration of Independence, to Lincoln trying to ameliorate fears during his campaigns that he would be too pro-Black, to Kennedy. And up to Obama. I believe they thought they were going as far as they could go and still be politically viable. But over the past 50 years, since the Voting Rights Act and the Immigration Reform Act, the numbers of people of color have become large. Those numbers, combined with progressive Whites who want to see a just and inclusive society, are, in fact, the majority. You can now stand for justice and equality and win. And you don’t have to worry any more that a policy agenda focused on justice and equality does not have majority support because, in fact, it does.

AGB: This new American majority has already achieved important victories. Although conservatives control the Congress, progressives — voters of color and White voters together — have elected progressive leaders in several states, and we see a city leadership across the country reflecting a progressive agenda. What are the takeaways in these victories for progressive candidates and their relationship with communities of color?

SP: First, we need people who will be champions of justice and champions of equality. Too frequently, people lead with caution and timidity and try not to alienate the more conservative, so-called swing voters. It’s a downward spiral. Not only do they fail to win those people over, but they also fail to inspire people who are most at risk in our society to come out and participate. Second, we need candidates who come out of communities of color. This is not just a question of identity politics. When a group has been exploited, marginalized, and oppressed for many years and someone comes out of that experience, you feel they understand your circumstance. You're more motivated to put that kind of person in office. That would be democracy as you see it — a leader who reflects your lived experience.

AGB: You're describing what so many of us have seen. But many progressives have been blind to the political potential of the rapidly growing communities of color. You take progressive leaders and funders to task for this. Why do you think they have failed to recognize the power of this remarkable demographic shift?

SP: At the highest level, there’s a history in this country of ignoring and diminishing people of color and their experience. Simultaneously, there’s been a celebration of White people, Whiteness, White intelligence. Even people who are progressives don’t realize the extent to which those biases play out in everything from hiring to policy decisions. I also think that those of us on the progressive side have to better explain that the path that we’re talking about is actually the path to victory. The incontrovertible record at the national level of the past eight years is that when we have put forward a candidate who comes from the communities of color and inspires the communities of color, we have won.

AGB: True! You also point out that an agenda that advances economic equity is a way to win elections. What are some of the policy changes that you believe really get at this agenda?

SP: The focus on minimum wage increases and the campaigns around the country have been interesting in that they have been very successful in lots of different states. It shows that there is agreement, even among sectors of more moderate White swing voters. Now issues around income inequality have become central to the popular debate. It is the source, I think, of a lot of the support and enthusiasm for Bernie Sanders. The next level is to actually go after the wealth inequality in the country. I don’t think we’ve done that sufficiently within the policy-debate realm. That’s when you begin to get at some really significant and potentially transformative approaches.

AGB: In the book you describe how several community organizations are successfully harnessing and channeling political energies from communities of color. What lessons can we extract about what these groups do and the attributes they bring to the work?

SP: California Calls, led by Anthony Thigpen out of Los Angeles, is the gold standard for this work. Anthony has built up an operation and a voter list from around 50,000 people to over half a million people by having a year-round program that is directly connected to the community organizations and the worker organizations that are in touch with and respected by the people of the local community. Groups that do immigrant service or work with domestic violence victims, labor unions who represent workers in those communities — those are the points of contact with voters. The genius of the model is in translating respect, trust, and familiarity into a voter mobilization operation. Building an electoral program on community-based organizations and leaders is far more effective than just running 30-second television ads.

AGB: You know, our demographics will continue to shift — nothing can stop that. Yet it is important for progressives to not sit on their laurels and think that demography is destiny. It depends on what you do with it. You point out in your book that conservatives are doing fairly well at identifying and backing candidates of color. What lessons can progressives learn from this?

SP: When you put your mind to it, you can do it!

AGB: Absolutely — race matters, race matters, race matters! I love how you end the book. You make it clear this is not just about the mathematical calculations of political campaigns; it’s really about the enduring legacy and centrality of race in American life. How do you move the nation to recognize that race matters? And how do we get people comfortable with embracing the idea that achieving a racial equity agenda is good politics, it’s good economics, and it’s good for the future?

SP: One of the things that’s not appreciated is that being forceful, forthright, and unapologetic around racial justice within this country will actually attract a number of progressive Whites to you. That was the subtext of Obama's election. It’s why there was great hope and meaning tied up in his election. I believe you can attract more Whites than people realize by offering a hopeful and inspiring vision that we’ll finally redress the history of racism within the country and the contemporary reality of racism. We can enlist a whole multiracial army of people to change the country. And that army will be a majority of the people.

Indicator Update: Unemployment Data Now Disaggregated by Both Gender and Race

The National Equity Atlas includes historical data on unemployment at the national, state, regional, and city levels. We have recently updated this indicator to provide more detailed information on unemployment by gender as well as race/ethnicity; here’s an overview of the unemployment data available in the Atlas and how you can use it.

What it measures

The unemployment rate reported in the Atlas is calculated as the number of people ages 25–64 who are out of work divided by the number who are in the labor force, defined as working or actively seeking employment (over the last four weeks). No data is reported for demographic subgroups with insufficient sample sizes.

Atlas users can compare unemployment by gender both within and between racial groups, and track trends over time, with data going back to 1990.

What it shows

According to the Federal Reserve Bank of New York, the unemployment gender gap (the difference between female and male unemployment rates) “virtually disappeared after 1980–except during recessions, when men’s unemployment rates always exceed women’s.” This is reflected in the data for the United States presented in the Atlas with the overall gender gap near zero in both 1990 and 2000, but with men’s unemployment rates exceeding women’s by 0.6 percentage points in 2012. (Because the data reported for 2012 represents a 2008-2012 average, these figures span the period during and immediately following the Great Recession.) In our 2012 data, women’s unemployment was lower than men’s in 45 states (plus the District of Columbia), 61 of the 100 largest cities, and 110 of the 150 largest metro areas.  

The newly disaggregated data also show that in each gender group, unemployment remains significantly higher among people of color. Nationally, unemployment for White men was 7 percent, compared with 10 percent for men of color. Among women the gap was even greater: 6 percent unemployment for White women and 10 percent for women of color. Of course, these figures vary greatly among different regions. For example, the tables below list the regions with the lowest unemployment rates among men and women of color.

The Atlas makes it easy to dig a little deeper and compare rates of unemployment across different racial and gender groups. The following chart displays more detailed information for the Anchorage, AK metro region, which has one of the highest gender unemployment gaps in country:

Unemployment rate by race/ethnicity and gender: Anchorage, AK Metro Area, 2012

To explore this data for another region, city, or state, visit the National Equity Atlas.

1.       Click on Indicators in the navigation bar;

2.       Select the Unemployment indicator under Economic Vitality;

3.       Select “By gender” in the breakdowns underneath the chart.

You can also learn more about strategies for addressing inequities in employment and where to find supporting data, and check out “Full Employment for All: The Social and Economic Benefits of Race and Gender Equity in Employment”—a report prepared by PolicyLink and the Program for Environmental and Regional Equity (PERE).

Chicago Tribune Cites Atlas Data on Changing Demographics and Educational Needs for Digitized Economy

In today’s Chicago Tribune, Mark Caro and Kathy Bergen use data from the National Equity Atlas to describe Chicago’s changing demographics and the widening skills gap the city will face in the coming years (“Chicago's future hinges on retooling schools for digital age”). Four years from now, in 2020, 47 percent of all jobs in the Chicago metro area will require at least an associate degree—but less than a third of Latinos and African Americans in the area have attained that level of education. Because people of color will make up almost half of the region’s population by then, Caro and Bergen explain, city leaders must act now to better meet the education and job-training needs of tomorrow’s workforce. They describe model solutions from around the country, like the innovative curriculum at Dalton High School in Dalton, Georgia, and the apprenticeship program at Siemens’ manufacturing plant in Charlotte, North Carolina. Read the story here and then visit the National Equity Atlas to learn more about education requirements and job readiness in your region.

Now on the National Equity Atlas: Median Wages by Gender


We are excited to introduce new data on the National Equity Atlas: our median wages indicator is now disaggregated by gender as well as race. Here we will describe what the indicator measures, discuss some related national trends, and show you how to get more information on the gender pay gap and what can be done to address it.

What it measures

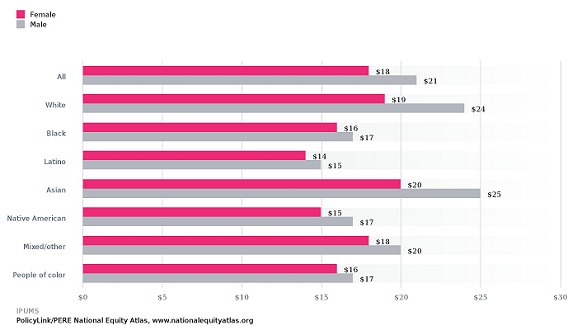
This indicator reports the median hourly wages (in 2012 dollars) of full-time wage and salary workers ages 25–64, by gender and race/ethnicity.  As the chart below illustrates, you can compare wages by gender both within and between racial groups, and track trends over time with data going back to 1990.


Above: Median Hourly Wage by Race/Ethnicity and Gender, United States

National trends

Nationwide, full-time working women now earn $0.86 for every dollar earned by their male counterparts, compared to $0.71 in 1990; this seems like encouraging progress, but according to a study by the Economic Policy Institute, 40 percent of that progress is explained by declining wages among men. The data in the Atlas support this conclusion: while women’s wages have risen by about 6 percent over the last few decades, men’s wages have fallen by nearly 13 percent. In addition, research has shown that the women continue to earn less than men not only because of differences in education, occupation, and family needs, but also as a result of gender discrimination and bias in the workplace. Across the U.S., White women earn about $0.79 for every dollar earned by White men, and the gaps are even larger for most women of color:

As the new data in the Atlas clearly indicate, gender pay gaps can’t be understood in isolation from racial pay gaps. Exploring some national trends can show how these dynamics are interconnected:

  • Overall, men earn more than women in all 50 states, all of the 150 largest metro areas, and 98 of the 100 largest cities. Nationally, men earn more than women within each racial group, and this trend holds true for the majority of metros and cities as well.
  • White women earn more than women of color in all 50 states, all of the 150 largest metros, and all but one of the 100 largest cities (excluding Hialeah City, Laredo City, and  Portland-South Portland-Biddeford, ME Metro, for which there are insufficient data to make such a comparison). These inequities persist even among women with similar levels of educational attainment. College-educated women of color, for example, earn an average of $23 per hour, compared to $28 per hour for White women with the same level of education.


New in the Atlas: City-level data

The greatest gender wage equality has been achieved at the city level, particularly in places where White women earn the most and men of color earn the least compared to White men—meaning the cities with the smallest gender pay gaps have some of the steepest racial pay gaps in the country.

Let’s take a closer look at Los Angeles as an example. In L.A., one of only two cities in the U.S. where women’s median hourly wages are slightly higher than men’s, men of color earn less than half the pay of their White counterparts: 

Above: Median Hourly Wage by Race/Ethnicity and Gender, Los Angeles 

White men are paid dramatically more than all other workers in the city of Los Angeles: White women earn $0.83, women of color earn $0.50, and men of color earn just $0.47 for every dollar earned by White men. Differences in education, occupation, and experience account for some but not all of these disparities; this is why the disaggregated data presented in the National Equity Atlas and other data tools like Clocking In (produced by Race Forward) are so important and powerful: they can help advocates and policymakers push forward creative, multidimensional solutions by showing how economic and social inequities are multilayered.

Strategies for reducing gender wage gaps

It is clear that city, state, and national leaders should focus on strategies that will address both gender and racial wage gaps, such as increasing the minimum wage, enacting living-wage laws, guaranteeing paid sick days, preventing wage theft, ensuring fair scheduling, and targeting economic development and workforce efforts to grow high-opportunity sectors that provide pathways to good jobs for people without four-year degrees. More specifically, strong protections against gender wage discrimination, like California’s new equal pay statute, can help ensure that workers are fairly compensated regardless of their gender.


How to get the data for your community

Visit the National Equity Atlas to explore data for your city, region, or state:

1.       Click on Indicators in the navigation bar;

2.       Select the Wages: Median indicator under Economic Vitality;

3.       Select By gender in the breakdowns underneath the chart.

Higher Education Doesn’t Close the Wage Gap for People of Color

In two recent National Journal articles, Matt Vasilogambros uses data from the National Equity Atlas to explore how the wages of workers in America’s 150 largest metro areas differ according to race/ethnicity and educational attainment (here and here). The Atlas provides data on median hourly wages broken down by race/ethnicity and level of education.

Overall, White workers earn more than people of color in every metropolitan area in the country—and the same pattern holds true within each category of educational attainment. (There are a handful of metro areas, most of which have incomplete data on the wages of workers of color, where Asians edge out Whites for the highest average pay.) Vasilogambros notes that “this gap in earn­ings between races and eth­ni­cit­ies is well-doc­u­mented, as are its reas­ons: Work­ing-age people of col­or tend to be young­er, have less ex­per­i­ence in skilled labor, and are less edu­cated than whites.”

While it is true that median hourly wages tend to rise with increasing educational attainment, so do racial wage inequities. According to Valerie Wilson, the dir­ect­or of the Eco­nom­ic Policy In­sti­tute’s Pro­gram on Race, Eth­ni­city, and the Eco­nomy, wage gaps have grown the most for college graduates. Data from the National Equity Atlas show that these hourly wage gaps are greatest (around $7 per hour) in cities like San Jose, San Francisco, and New York, where average levels of education and median wages are much higher. The narrowest gaps—still around $2 per hour—are seen in metro areas where the median pay for all workers is far below the national average. As Wilson puts it, “Things tend to equal out at the bot­tom, un­for­tu­nately.”

Sarah Treuhaft, the dir­ect­or of equit­able growth ini­ti­at­ives at Poli­cyLink, underscores the significance of these wage inequities, which are expected to grow as U.S. demographics continue to change. “It im­pacts the over­all eco­nomy,” says Treuhaft. “If people are not earn­ing as much pay, they have less money to save, to edu­cate their child, to spend in the eco­nomy, which fosters more eco­nom­ic activ­ity. Over­all, that ra­cial gap in wages adds up to a big gap in eco­nom­ic prosper­ity for the re­gion.”

Pages