Among the 10 Most Populous Cities, African Americans Remain Underrepresented in Business Ownership

 
Examining data on business diversity and growth for 2007 and 2012, we find large Black/White gaps in business ownership across all the 10 largest cities and declining revenues and wages for Black-owned businesses in most of the cities. San Antonio stands out for having positive performance among Black-owned businesses across all indicators.
 

Removing barriers that prevent people of color from starting and growing successful businesses is a crucial inclusive growth strategy. Entrepreneurship is an important pathway for building wealth and addressing the racial wealth gap, as well as for providing self-employment and income. Entrepreneurs of color also play a major role in creating employment opportunities: research shows that entrepreneurs of color are more likely to hire people of color and locate their firms in communities of color.

While businesses owned by people of color today make up a significant and growing share of businesses in cities across the country, entrepreneurs of color remain underrepresented in business ownership – particularly among high-revenue firms and firms with paid employees. Historic and present-day racial discrimination has contributed to racial inequities in business ownership and growth. The racial wealth gap makes it more difficult for people of color to start a business in the first place, and lack of access to capital adds to the challenge.

To help communities understand how they are doing on racial equity in entrepreneurship, the National Equity Atlas now includes four new indicators of entrepreneurship. These indicators are based on data  from the Census Bureau’s Survey of Business Owners, a twice-a-decade survey designed to paint a picture of all firms — incorporated or not, with and without paid employees — with annual receipts of $1,000 or more by race, ethnicity, and gender. This survey represents the only data source with sufficient sample sizes to examine race and gender equity in entrepreneurship for all the geographies available in the Atlas, including the largest 100 cities. The latest data on the Atlas is from 2012 – after which point the survey was discontinued and is soon to be replaced by the Annual Business Survey.

Using this data, we examined the representativeness and growth rates of Black-owned businesses in the nation’s 10 largest cities (based on 2010 population) from 2007 to 2012. We focused on cities because many policies that foster entrepreneurship, from tax incentives to small business loan programs operate at the city level. We examined how the largest 10 cities measure up when it comes to measures of growth and success for Black-owned business. We focused only on firms with paid employees due to their greater economic impact on local economies.

Uneven Growth in Black-Owned Firms and Labor Force

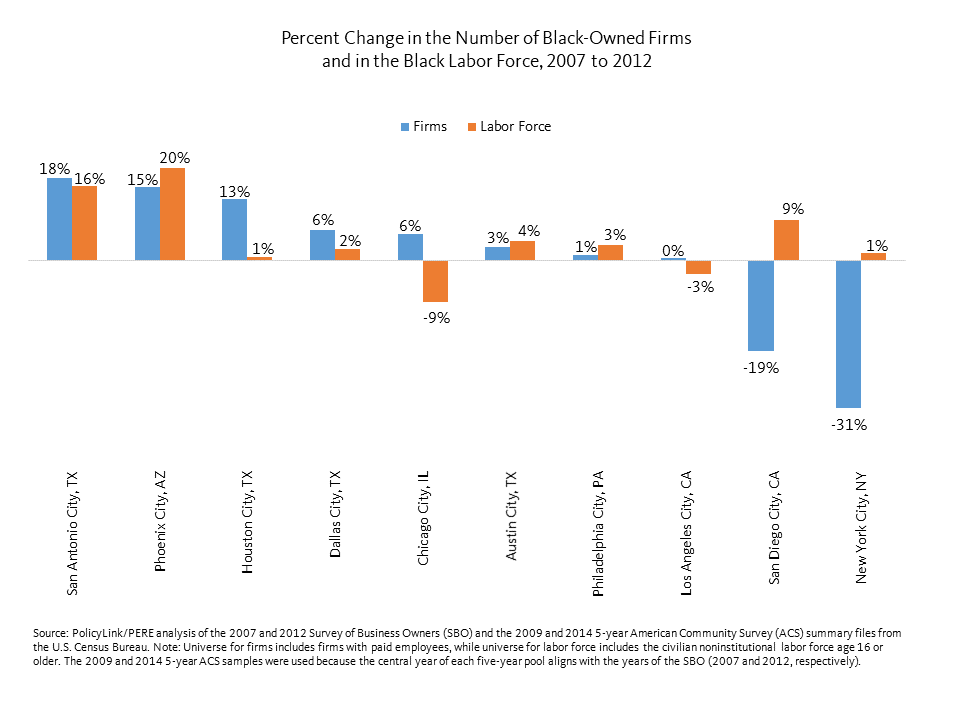
Nationally, the average growth rate for black-owned businesses with employees across the top 100 most populous cities was 19 percent. Across the top 10 cities, growth rates ranged from an increase of 18 percent in San Antonio to a decrease of 31 percent in New York City. Phoenix and Houston also had high growth in Black-owned businesses, while San Diego saw a decline of 19 percent.

Comparing the growth of Black-owned firms with the growth of the Black labor force (a proxy for potential business owners), we see that the two cities with the most firm growth also had the greatest labor force growth; San Antonio and Phoenix experienced growth rates upwards of 10 percent in both Black-owned firms and in the size of Black labor force. In Houston, however, there was strong growth in firms but minimal growth in the Black labor force, indicating a rise in the rate of business ownership. On the other end of the spectrum, New York and San Diego saw rapid declines in the number of Black-owned firms alongside growth in the labor force, suggesting a decline in the rate of business ownership. Overall, the relationship between the two measures is weak, suggesting that growth in Black-owned firms is not simply a function of growth in potential business owners.

Black/White Differences in Business Ownership

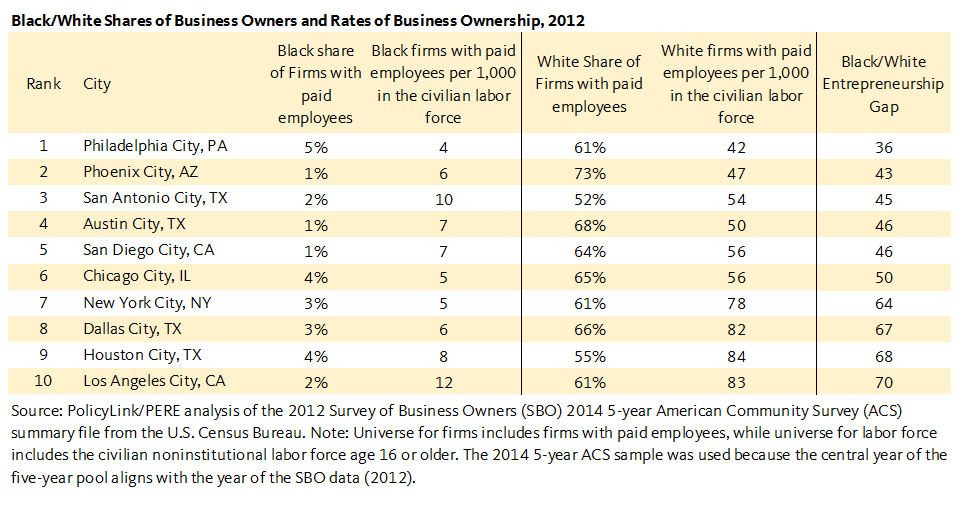
To compare rates of Black and White entrepreneurship across cities, we can look at the number of firms per 1,000 people in the labor force. Examining the 10 largest cities, there is variation in the rates of entrepreneurship in general — that is, rates for both the Black and White populations are relatively higher in Los Angeles and Houston, and relatively lower in Philadelphia and Chicago – but also the rates for the White population are substantially higher than those for the Black population. Los Angeles is the city with the highest number of Black-owned firms with paid employees per 1,000 in the civilian labor force but it also has the largest Black/White entrepreneurship gap at 70 points — meaning that there are 70 more business owners per 1,000 people in the labor force among the White population. This racial gap appears to be driven by the level of White entrepreneurship — influenced by the fact that often White entrepreneurs have more generational wealth and easier access to the financial capital needed to start a business. Philadelphia has the lowest rates of entrepreneurship for both the White and Black populations, along with the smallest entrepreneurship gap of 36 points.

Declining Revenues for Black-owned Firms

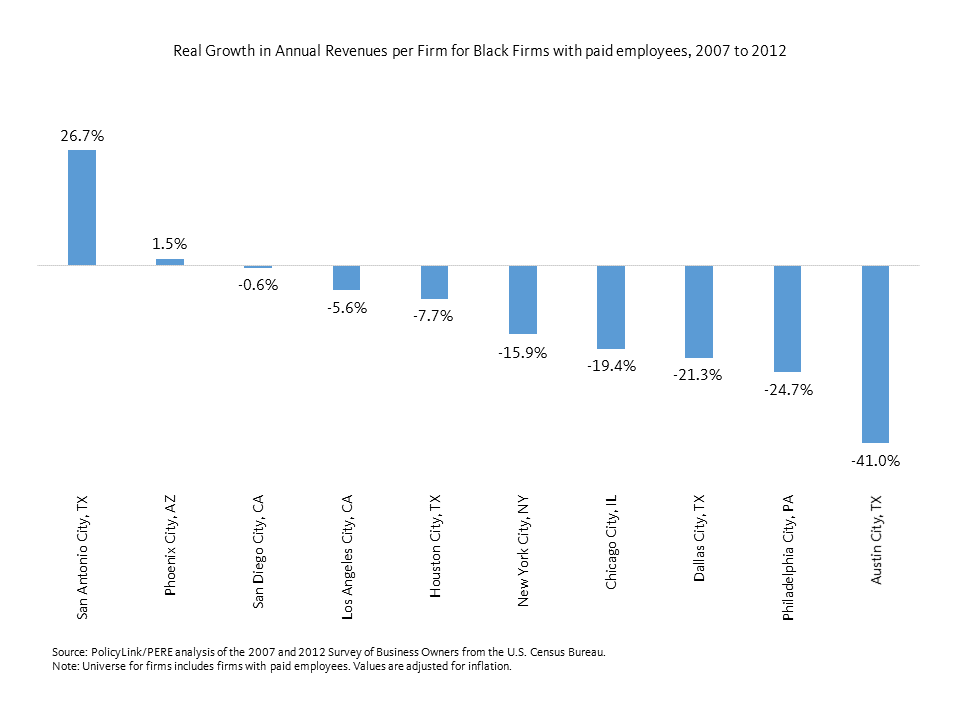
Our most populous cities had mixed success in terms of revenue growth for Black-owned firms, but they declined in eight of the largest 10 cities between 2007 and 2012. The only two cities that saw increases in (inflation-adjusted) revenues per firm for Black-owned firms with paid employees were San Antonio at 26.7 percent (an average increase of about $140,000 per firm) and Phoenix at 1.5 percent (an average increase of about $12,000 per firm). Austin and Philadelphia saw the largest declines in revenues at 41.0 percent and 24.7 percent.

Diverging Growth in Employee Pay Among Black-owned Firms

Another important measure of understanding how well Black-owned businesses are doing is whether they are able to increase pay for their workers over time. This is particularly important given that employee pay among Black-owned firms is generally much lower than in other firms, and because Black-owned firms are more likely to hire Black workers, the ability to increase pay can have a positive impact on the racial earnings gap. For a sense of how far behind Black-owned firms are in the wages they are able to provide, the Survey of Business Owners reports average pay per employee for the United States in 2012 of about $37,400 and the average pay per employee for Black-owned firms of only about $28,400.

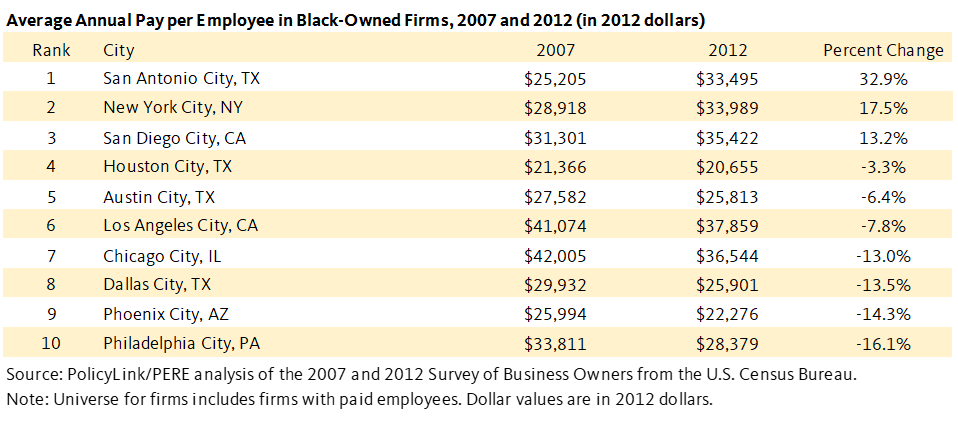
Looking at inflation-adjusted annual pay per employee for Black-owned firms between 2007 and 2012, we see that annual pay per employee for Black-owned firms only grew in three of the largest 10 cities — San Antonio (32.9 percent ), New York (17.5 percent), and San Diego (13.2 percent). In contrast, Black-owned businesses saw the greatest declines in annual pay per employee in Philadelphia (-16.1 percent), Phoenix (-14.3 percent), Dallas (-13.5 percent), and Chicago (-13.0 percent).

In addition to per employee pay, San Antonio also scored well on other metrics including experiencing the greatest growth in annual sales for Black-owned firms, one of the lowest White/Black Entrepreneurship gaps, and among the largest increases in the number of Black-owned firms and the size of the Black labor force. This diverged from New York and San Diego where annual pay per employee grew despite declines in the labor force. New York was a particularly interesting case because wages grew even while the city had the seventh highest Black/White entrepreneurship gap.

A Need for Equitable Entrepreneurship Strategies

Across the 10 largest cities, there were large racial gaps in Black and White business ownership everywhere, but some cities did show better performance than others. San Antonio showed consistent positive signs for Black-owned businesses on all measures examined: growth in firms, revenues per firm, employee pay, and Black/White gap in entrepreneurship. Meanwhile, New York showed consistent negative signs with the greatest decline in the number of firms, declining revenues per firm, and one of the largest Black/White entrepreneurship gaps.

Certain factors that are associated with increased success in entrepreneurship include wealth, access to capital, and formal and experience-based human capital, which can consist of formal education or experience running family-owned business. Policies and programs that address any of these barriers should help to increase the number of Black business owners and support their long-term success. Finally, incentive programs that lower financial barriers to entry for Black entrepreneurs could help foster business ownership.

To access data on entrepreneurship for your city, region, or state; and to learn more about policies to expand business ownership for entrepreneurs of color, see the four new indicators available in the Atlas: Firm Diversity, Revenues, Business growth, and Revenue growth.

California Leads on Juvenile Justice Reform

This week, California Governor Jerry Brown signed Senate Bill 190, co-authored by Senators Holly Mitchell and Ricardo Lara — ending the regressive and racially discriminatory practice of charging administrative fees to families with youth in the juvenile system.

California and nearly every other state charge parents of youth involved in the juvenile justice system with various fees, including fees for detention, legal representation, probation supervision, electronic monitoring, and drug testing. These fees trap poor families in debt,
particularly families of color, and according to a study by the U.C. Berkeley Law School Policy Advocacy Clinic, significantly increase the likelihood of recidivism. Though the fees are designed to reimburse local governments for costs related to a child’s involvement in the juvenile justice system, counties often spend as much, if not more, to collect the fees as they take in. 

PolicyLink, working in coalition with state advocacy organizations, co-sponsored and advocated for SB 190, which will prevent California counties from charging juvenile administrative fees. As the first state in the nation to eliminate the fees, the passage of Senate Bill 190 could spark similar reforms in other states. According to PolicyLink senior associate Lewis Brown Jr., “Imposing fees on poor parents who are struggling to make ends meet is not the way to fund our juvenile justice system. Hopefully, Senate Bill 190 is the first step toward eliminating these destabilizing and counterproductive fees throughout the country.” 


We applaud our coalition partners, as well as Senator Mitchell, Senator Lara, and Governor Brown, for their leadership in addressing this important issue. We look forward to working with others to ensure that SB 190 will serve as a model for other states looking to address juvenile, and other types of criminal justice fines and fees.

Click here for information on Senate Bill 190>>>

Tax Alliance for Economic Mobility Provides Feedback to the Senate Finance Committee on How to Improve Tax Reform

In response to Senate Finance Committee Chairman Orrin Hatch’s (R-Utah) call for input and feedback from tax stakeholders across the country on how to improve the American tax system through tax reform, The Tax Alliance for Economic Mobility submitted the following letter to the Finance Committee that focuses on reform that outs low and moderate income people first, and fuels upward economic mobility instead of exacerbating an already-growing wealth divide.

The letter hones in on four sets of principles for reform of tax-based aid that can lead to more equitable programs that will expand opportunity throughout the country:

  1. Increasing Financial Security for Working Families;
  2. Making Higher Education Tax Expenditures Work for Everyone;
  3. Using the Tax Code to Encourage Savings and Investment for Retirement
  4. Reduce Subsidies for Mortagage Debt and Larger Homes Owned by High-Income Households

Read the full letter here and sign up for the Tax Alliance newsletter for updates on our work.

PolicyLink Launches All-In Cities Policy Toolkit


Today marks the launch of the All-In Cities Policy Toolkit, a new online resource designed to help leaders inside and outside city government identify, understand, and choose targeted policy solutions to advance racial economic inclusion and equitable growth.

The toolkit includes an initial selection of 21 tools, including, but not limited to: Equitable contracting and procurement, Financial empowerment centers, incentivized savings accounts, living wage, local and targeted hiring, minimum wage, worker-owned cooperatives, and more. New content and additional policies will be added throughout 2017 and beyond. The toolkit provides examples of specific policies that local leaders can adapt to their own economic and political contexts, key considerations for design and implementation, and outlines where these policies are working to advance racial and economic equity.

This toolkit is just one resource from All-In Cities. Through this initiative, PolicyLink continues its work to change the dialogue about how and why equity matters to city and regional futures, while working hand-in-hand with city leaders to advance equitable growth strategies.

Introducing New Maps: Unemployment by Neighborhood

This blog provides step-by-step directions for using the new mapping breakdown in the National Equity Atlas. The beta version is now live for the unemployment indicator, and we will be adding maps for three additional indicators next month.

While overall city and regional averages are helpful for establishing a benchmark on an indicator like unemployment — as well as understanding how a place ranks in comparison to neighboring localities or the U.S. as whole — there is often considerable variation within a given place. It’s critical to understand this variation in order to develop targeted strategies that tackle spatial inequities. If a substantial share of the unemployed population lives in just a few neighborhoods, it’s important for workforce development and targeted hiring initiatives to focus on those areas.

How to find the new maps

Take the Memphis, Tennessee, metro area as an example. To see the map, go to the Indicators section of the National Equity Atlas and under the Equity menu, select Unemployment. Underneath the graphic display, select the “Unemployment map (beta)” breakdown. Under Geography, on the upper right-hand side of the page, select “Regions” and zoom into Tennessee. As you hover over Memphis, you’ll see that the unemployment rate for the region was 11 percent in 2014 (which reflects a five-year average from 2010-2014).

Then in the search box at the top of the page, type in Memphis and select the “Memphis, TN-MS-AR Metropolitan Statistical Area.” The result is a census-tract level map of the region. The overall unemployment rate was 11 percent — but clearly this was not the case across all neighborhoods or across all race/ethnic groups. For Whites in the region, the unemployment rate was 7 percent, while the unemployment rate for people of color was more than double at 15 percent. Similarly, census tract 33 in East Midtown (in Shelby County), which is more than 90 percent White, had an unemployment rate under 2 percent in 2014. Just four miles down the road in South Memphis is census tract 78.21, which is less than 1 percent White, with an unemployment rate of 40 percent (see screenshot of map below).

(Note: the census tract level maps are only available at the state, region, or city level.)

As you hover your mouse over a census tract, an info box will appear with the unemployment rate for that tract as well as the total number of people who are unemployed. In Census Tract 33, just 23 people are unemployed, while over 1,000 people are unemployed in Census Tract 78.21. These maps are especially helpful in developing targeted hiring or workforce development initiatives because they allow users to see where such programs would be most impactful.

Comparing over time and across race/ethnicity

Another interactive component of the maps allows users to toggle between geography, years, and race/ethnicity. In the panel to the right of the map are several options: You can view the map by tract, place, or county and you can select data from either 2000 or 2014 to see how the geography of unemployment has changed over time. You can also view unemployment rates for Whites and for people of color independently.

The screenshots below show the unemployment rate for Whites on the left and for people of color on the right. Many tracts in the White unemployment map are blank because there aren’t enough White people living in those tracts to report data. Toggling back and forth between White unemployment and unemployment for people of color provides a clear visual example of persistent racial residential segregation and enduring employment barriers for people of color.

Assessing unemployment in communities of color

The last and perhaps most interactive element of the maps is the race/ethnicity filter. The filters powerfully illustrate both segregation and disinvestment in communities of color. If you select, for example, “Black areas”, then move the scroller at the bottom of the page to 50 percent, you will only see tracts where the Black population is at least 50 percent (see screenshot below). All tracts with a Black population less than 50 percent are greyed out, and you’ll notice that many of the lightest green areas, those tracts with the lowest unemployment rates, disappear. Meanwhile, the darkest blue tracts, symbolizing the neighborhoods with the highest unemployment rates, remain. These maps can inform both infrastructure investments and targeted hiring to ensure that the communities most affected by unemployment are the ones who receive resources.

 (Note: the filter only works when the population selected is “All”.)

Explore the maps and share your feedback

It was in response to user requests for county and sub-county data, and data for rural areas, that we added maps by county, tract, and place for the entire country, including areas that are not part of the largest 100 cities or the largest 150 metro areas.

We invite you spend some time exploring this new feature ahead of the public release of maps for three additional indicators (people of color, race/ethnicity, and disconnected youth) at the end of the month. Register for our 30-minute webinar on Thursday, October 6 at 12PM PDT for a more extensive walk-through of the unemployment maps and to share your feedback on the beta version. You can also share your feedback about the maps using our contact form.

New Report Makes Case for Equity in Metro Atlanta

A new report from the Partnership for Southern Equity (PSE), Growing the Future: The Case for Economic Inclusion in Metro Atlanta, describes how equity is both a moral and economic imperative for the Atlanta region and for the nation as a whole. The report highlights the full employment analysis and GDP with racial equity analysis conducted by the National Equity Atlas team, both of which underscore how eliminating racial inequities results in “equity dividends” for the broader economy. PSE writes:

“The Partnership for Southern Equity defines economic inclusion as: ‘Increasing equity in the distribution of income, wealth building, employment, and entrepreneurial opportunities for vulnerable populations.’ In this definition, equity is a step beyond equality because it takes into account that people may not start from the same place and, therefore, ‘equal’ treatment may not resolve the gap that exists. […] Economic inclusion is a win-win for society because an increase in productive citizens who can participate in the economy, purchase goods, and contribute to cultural and business innovation leads to that society’s growth and sustainability.”

Growing the Future is data driven and includes spatial analyses of several indicators including unemployment, job location, income, and education that show how the historical roots of segregation persist today. 

The report also describes several examples of strategies already in action locally and across the country that address regional inequities, and lays out six principles of economic inclusion to guide development of policies moving forward. To learn more about the Partnership for Southern Equity, click here

Fairfax County Adopts “One Fairfax” Resolution, Committing to Equitable Growth

Fairfax County, Virginia is one of the wealthiest counties in the nation — but not all of its residents have been able to participate and share in its prosperity. In 2015, as part of a larger effort to address structural barriers to inclusion, community leaders working inside and outside of government partnered with the National Equity Atlas team at PolicyLink and PERE to produce an equitable growth profile of the county. That report highlighted how communities of color are driving the county’s rapid population growth and now represent 45 percent of its population, yet racial inequities persist across a multitude of indicators.

Equipped with the facts, local leaders worked to educate decisionmakers and build broad support for an equity approach. In 2015, the Board of Supervisors acknowledged equity as a key principle in its Strategic Plan to Facilitate Economic Success, and a core group of equity leaders proposed a countywide “One Fairfax” resolution, asking county and school district leaders to develop and implement a data-driven racial and social equity policy. The Fairfax County Board of Supervisors adopted the resolution last week, making its commitment to equity official; the school board is expected to vote on “One Fairfax” before the end of the month. 

Latinos See the Highest Increases and Levels of Working Poverty in Many Regions


As Latinos drive population growth and change in America, their ability to thrive is increasingly critical to the health of our economies locally and nationally. Yet, new data on working poverty in the National Equity Atlas reveals the extent to which many Latinos are working full-time yet still struggling economically. In 2012, nearly one in three Latino full-time workers, ages 25 to 64, earned below 200 percent of poverty – up from 27 percent in 1990 and compared with 9 percent for their White counterparts.

This post takes a closer look at Latino working poverty across the nation’s largest 150 metropolitan regions. Working poverty describes full-time workers with a family income below 200 percent of poverty, and the rates of working poverty in this post reflect the working poor as a share of full-time workers ages 25 through 64. While poverty is defined at the family level, based on combined income from all family members, in this post we make reference to individual earnings for simplicity. Given that an individual’s family income must be as high or higher than their personal earnings, the rates of working poverty reported here understate the rates that would be found if only an individual’s earnings were considered.

Latino Working Poverty High and Increasing in Many Regions

Not only do many regions have high rates of Latino working poor, conditions are getting worse over time. This is shown by the scatter plot below, which plots the largest 150 regions by the share of Latino full-time workers who earn below 200 percent of poverty in 2012 and the percent increase in Latino working poverty between 2000 and 2012. The farther to the right, the greater the share of Latino working poverty in 2012. The higher up on the chart, the greater the percent increase in Latino working poverty between 2000 and 2012. As illustrated by the number of metros in the upper-right quadrant, there appears to be a positive relationship: the regions with higher rates of working poverty among Latinos also saw a sharp growth in Latino working poverty.

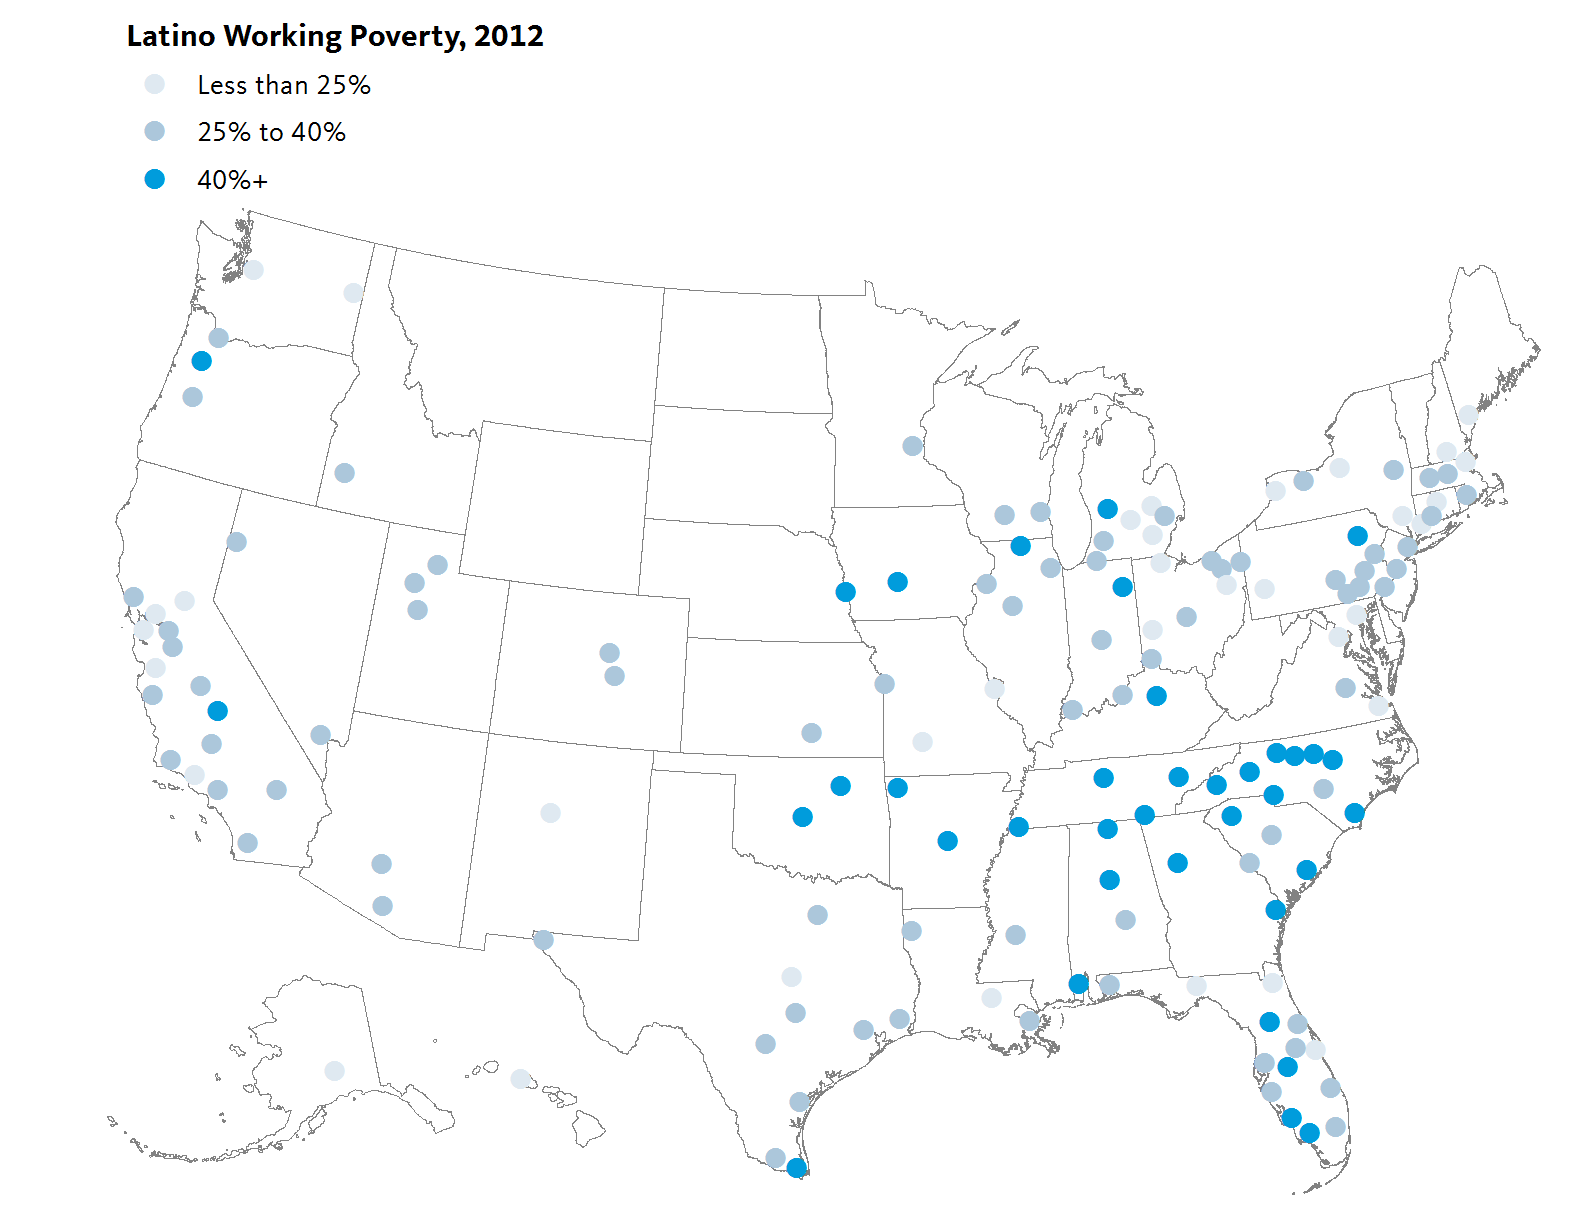
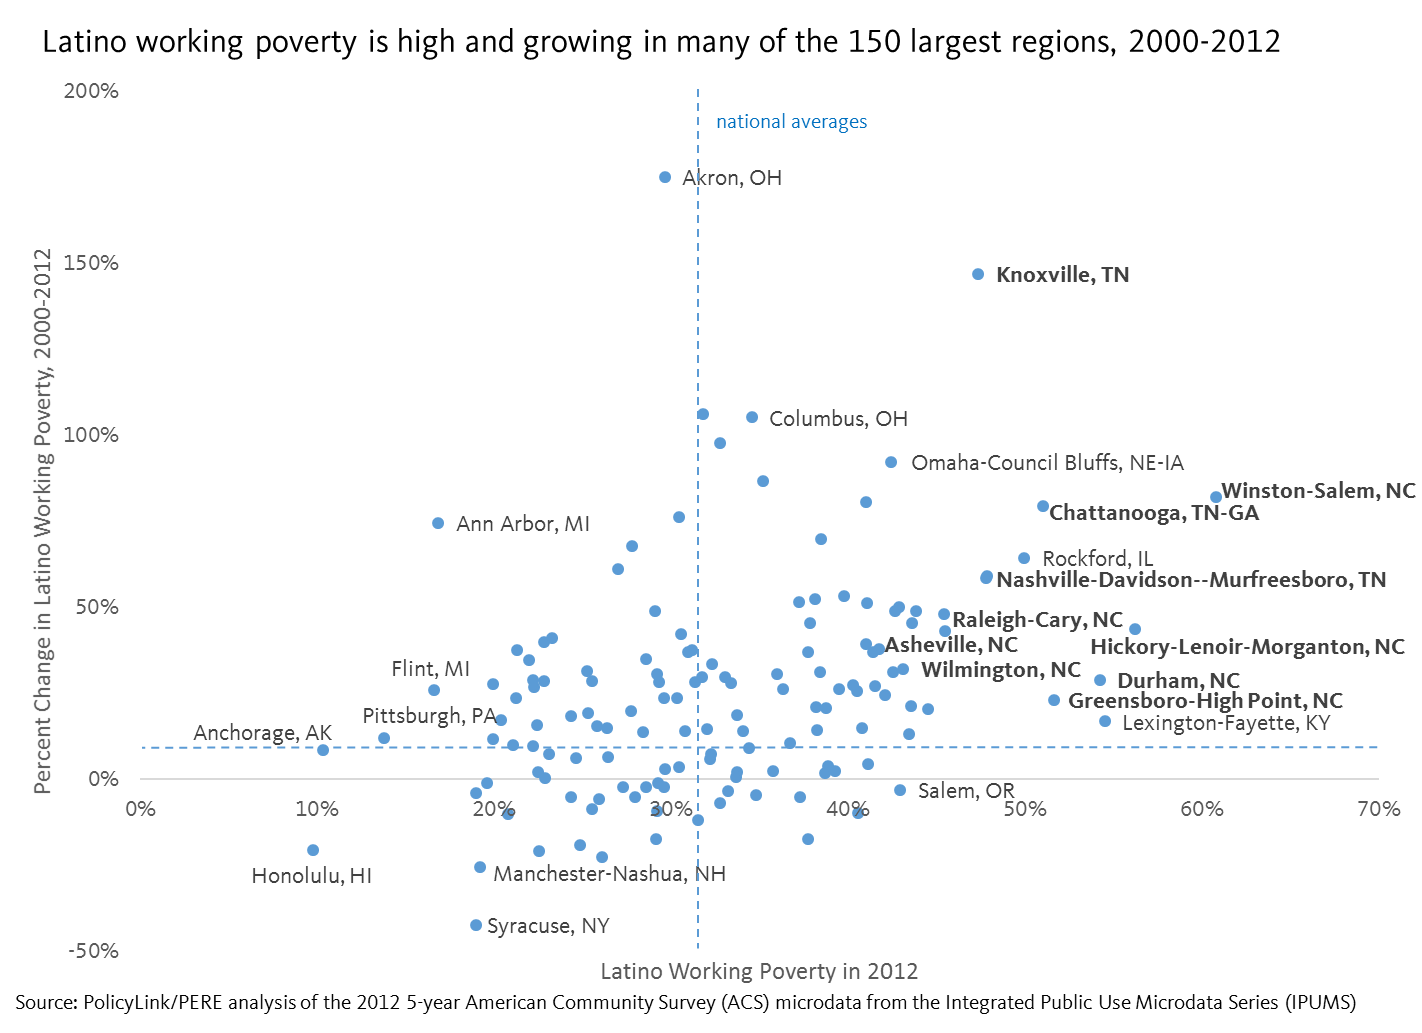
Regions in Tennessee and North Carolina have the highest rates of Latino working poverty

Mapping the data reveals additional geographic patterns, including the clustering of Latino working poverty in the South and particularly in the states of Tennessee and North Carolina. Of the largest 150 metro regions in the U.S., all nine in North Carolina saw substantial increases in working poverty among Latino full-time workers, ranging from a 23 percent increase in Greensboro to an 82 percent increase in Winston-Salem. Each region also had a Latino working poverty rate greater than the national average except for Fayetteville, which matched it. More than half of Latino full-time workers in Greensboro, Durham, Hickory, and Winston-Salem earned less than 200 percent of poverty.

Similarly, the four regions in Tennessee included in the Atlas saw higher than average increases in the overall rates of Latino working poverty. One in two Latino full-time workers in Chattanooga earned less than 200 percent of poverty in 2012, up from 28 percent in 2000. Over the same time period, the Latino population grew significantly faster than any other group in the region.

Tennessee and North Carolina are among the roughly 15 states that currently ban local governments from adopting their own minimum wage laws. Part of the controversial HB2 law passed earlier this year in North Carolina, which restricts usage of multiple occupancy bathrooms for transgender and gender non-conforming people, also includes state preemptions to local minimum wage increases. The current minimum wage in Tennessee and North Carolina is the same as the federal: $7.25 an hour. The MIT Living Wage Calculator, however, estimates that a living wage for a family of four ranges from $13 to $22 an hour in Tennessee and from $14 to $23 an hour in North Carolina. The state preemption laws also prevent localities from allowing workers to earn paid sick leave.

This is a growing and alarming trend: eight states have considered restrictions on local minimum wage increases this year and the story is often similar. When states fail to pass increases in minimum wages in step with increases in cost of living and inflation, some jurisdictions take matters into their own hands by increasing local minimum wages. State legislatures—especially those led by Republicans—push back by adopting laws preventing local action. Raising wages would be especially beneficial to workers of color. In North Carolina, for example, 11 percent of White full-time workers earn less than 200 percent of poverty compared with nearly half of Latino full-time workers. Even more striking, 12 percent of Latino full-time workers earn less than 100 percent of poverty.

Addressing working poverty is a moral and economic imperative. If Latinos, the fastest growing group in many regions, are unable to participate, prosper, and reach their full potential, the impacts will go far beyond the Latino population. To learn more about working poverty in your city, region, or state, and learn about policies that lift the wages of workers, explore the new working poor indicator.

An Overview of America’s Working Poor

Wage stagnation and the increasing number of people who are working yet still poor are significant challenges of our era. One recent study found that there isn’t a single congressional district in the country where a full-time minimum wage worker could afford a two-bedroom apartment. With the rapid growth of unstable, low-paying jobs and the failure of even full-time work to pay family-supporting wages, it is critical to understand working poverty in order to enact policies that lift working families out of poverty.

This analysis describes trends in the persistence of working poverty in America drawing from new data added to the National Equity Atlas. Most measures of the “working poor” count everyone who spent at least the last 6 months in the labor force—including those employed part-time, seasonally, and even the unemployed. We use a more restrictive measure in our analysis counting only full-time workers between the ages of 25 and 64 who fall below 200 percent of poverty. Users can explore rates of working poor at 100 percent, 150 percent, and 200 percent of poverty, but for this analysis, “working poor” is defined as full-time workers below 200 percent of poverty.

Why focus on 200 percent of the poverty line?

We believe that looking at the population below 200 percent of poverty provides a more accurate picture of economic insecurity in the United States. Some argue that the poverty level is too low, particularly in more expensive metro areas. Others point out that that experience of poverty is more porous than a poverty line, which fails to capture the millions of families who move in and out of poverty each year or those families at risk of falling into poverty if they lose a job or have a medical emergency. A family of four below 200 percent of poverty in 2012 had a family income less than $46,000 a year. There are currently over 100 million people living below this threshold in the U.S.—one in three people.

The 12 Million Working Poor

While a large number of that 100 million living at or below 200 percent of the poverty line are children and seniors, over 12 million of them are full-time workers between the ages of 25 and 64. Of these full-time workers earning less than 200 percent of poverty, the majority -- 56 percent -- are workers of color. Working poverty has increased dramatically over the last three decades, growing from less than 7 million in 1980 to today’s 12.4 million. Of all full-time workers ages 25 to 64, the share who were working poor declined slightly between 1980 and 2000 before increasing by 19 percent in 2012. In the 1980s and 1990s, the working poor rate hovered around 12 percent, but by 2012, was close to 14 percent.

Latino workers face the highest and fastest-growing levels of working poverty

Breaking down the overall data by race reveals that Latinos are the only major racial/ethnic group to experience continual increases in working poverty over the last three decades. In fact, increases in the overall rate of working poverty are driven largely by increases among the Latino population. In 1980, about a quarter of Black and Latino prime-age full-time workers were working poor, more than twice the rates of Whites. But over the next two decades, as the rates declined among Black workers, it increased for Latinos. Even more alarming, Latino full-time workers are 4.5 times more likely than White full-time workers to earn below the federal poverty line and nearly one in three Latino full-time workers fall below 200 percent of poverty.

The nation’s demographic changes magnify the importance of these trends. Latinos and APIs are among the fastest growing groups in the U.S. and they not only saw the largest increases in working poverty over the last decade but they were also the only groups to experience increases since 1980. By 2012, Latinos were more than three times as likely as Whites to be working poor.

What this means for the future

The promise of work is part of the American Dream. Most Americans believe that people who work, especially those working full-time year round, should be earning enough to provide for their families. But nearly one in three Latino full-time workers between the ages of 25 and 64 still bring home a family income below 200 percent of poverty (and that includes the income of all other family members as well as income from sources other than work). And the experience of working poverty for most racial/ethnic groups in the U.S., including Whites, has increased since 2000, signifying a disturbing trend in the labor force and a need for policy that ensures all work pays a fair wage.

These increases in working poverty are explained, in part, by changes in economic structure and policy. Over the last several decades, businesses have generated a disproportionate amount of low-wage jobs and wages have been flat for all but the highest earners (see the Job and wage growth indicator). To make matters worse, growing unemployment during the Great Recession pushed down on wages even further. Lifting the wages of workers requires a robust policy agenda like the one proposed by the Economic Policy Institute that tilts power back into the hands of workers. To learn more about policies that lift full-time workers out of poverty like the Earned Income Tax Credit and minimum wage increases and to explore the new working poor indicator, click here.

New Data Highlights Vast and Persistent Racial Inequities in Who Experiences Poverty in America

Already the majority of children under five years old in the United States are children of color. By the end of this decade, the majority of people under 18 years old will be of color, and by 2044, our nation will be majority people of color. This growing diversity is an asset, but only if everyone is able to access the opportunities they need to thrive. Poverty is a tremendous barrier to economic and social inclusion and new data added to the National Equity Atlas highlights the vast and persistent racial inequities in who experiences poverty in America.

On June 28, we added a poverty indicator to the Atlas, including breakdowns at three thresholds: 100 percent, 150 percent, and 200 percent of the federal poverty line. We also added an age breakdown to the new poverty indicator, in response to user requests for child poverty data, which allows you to look at poverty rates across different age groups including the population under 5 and 18 years old as well as those 18 to 24, 25 to 64, and 65 and over.

Why examine different levels of poverty? In 2012, the federal poverty level was less than $12,000 for a single person and roughly $23,000 for a family of four with two adults. Many believe that this is too low. The National Center for Children in Poverty argues, for example, that families need an income at least double the federal poverty level to meet basic needs. Another critique relates to the varying costs of living across communities. $23,000 will go much further in a lower-cost region like McAllen, TX compared with a high-cost one like San Francisco or Washington, DC. To understand the broader universe of families experiencing economic insecurity, this analysis focuses mainly on the population below 200 percent of poverty.

 People of color have the highest rates of economic insecurity, while Whites saw largest increase since 2000

Looking at how the share of people living at or below 200 percent of poverty has changed since 1980, we see a few trends. First, economic insecurity (defined in this way) decreased for all racial/ethnic groups except Latinos, who saw an increase of two percentage points over the three decades. During the same time period, Latinos went from just 6 percent of the population to 16 percent and were the fastest growing population over the last decade. In other words, the same demographic group driving growth and change is increasingly experiencing economic insecurity.

Second, the largest overall increases in economic insecurity over the past three decades in the U.S. occurred between 2000 and 2012. During that period, rates increased for all groups except Asian and Pacific Islanders (APIs). Interestingly, Whites have seen the largest increase in economic insecurity since 2000 despite having the lowest rate by far of all major racial groups.

Third, while there are large racial inequities in who experiences economic insecurity, it is a widespread challenge that affects all racial/ethnic groups including Whites. Half of people of color live below 200 percent of poverty compared with only a quarter of Whites but that does not mean Whites are immune to poverty – that percentage represents nearly half of the total U.S. population below 200 percent of poverty.

The share of people of color experiencing economic insecurity ranges from less than a quarter of people of color in Honolulu to nearly two in three people of color in Brownsville, TX

While nationally just under half of all people of color fall below 200 percent of poverty, local percentages vary considerably across metropolitan regions, from 65 percent in Brownsville, TX to 23 percent in Honolulu. In order to understand these numbers, it is important to consider the local cost of living, since poverty rates are universal, while costs of living vary tremendously by region. We can do that by looking at “regional price parities" (or RPPs). Calculated by the U.S. Department of Commerce Bureau of Economic Analysis, RPPs indicate relative differences in the cost of goods and services across states and metropolitan areas.  They are expressed as a percentage of the average national price level, and range from the highest cost region, Honolulu, at 123 down to McAllen, TX, the lowest cost region in the Atlas, at 84.9.

In general, places with the highest rates of economic insecurity also tend to have lower costs of living: Four out of the five regions with the largest shares of people of color living at or below 200 percent of poverty fall within the bottom third of the 150 largest U.S. metros with the lowest cost of living. And the five regions with the lowest shares of people of color below 200 percent of poverty fall within the 10 most expensive metros in the Atlas. But an affordable rent under this poverty threshold would be less than $1,150 a month for a family of four—which would be nearly impossible to find in these higher cost regions.

The demographic makeup of the regions with the largest shares of people of color experiencing economic insecurity are at both ends of the spectrum: Hickory and Scranton are much whiter than the U.S. as a whole while Brownsville, McAllen, and Visalia are much browner. But they all have one thing in common: people of color are projected to drive the vast majority of population growth over the next couple decades while the White population is expected to decline.

Communities of color are actually the fastest growing segments of the population in most regions, including those with majority White populations, but they continue to face barriers to educational and economic opportunities, stifling their own potential, the potential of the regions where they live, and that of the country as a whole.

Black and Native American children most likely to experience poverty

When looking at the population under 18 years old, roughly 63 percent of Black and Native American youth live below 200 percent of poverty compared with 31 percent of White and API youth. Children of color are nearly twice as likely as White children to be economically insecure. Even more alarming is that the share of kids under 5 years old, who are already predominately children of color, is even higher. More than two in three Black, Native American, and Latino children under five years old live below 200 percent of poverty. Given what we know about the adverse effects of child poverty, it is alarming that the two largest groups of kids of color, Latinos and Blacks, have the highest poverty rates.

The implications of these findings are far-reaching. Not only will the children of today become the workers of tomorrow, who will be expected to support the growing retired population, but child poverty is also estimated to cost the U.S. economy $500 billion a year, underscoring the importance of racial equity for enduring prosperity. Explore poverty in your city, region, or state here. For more data highlighting the gap between the aging white population and the growing population of youth of color, see the racial generation gap indicator.

Pages