Chart of the Week: #Fightfor15 this Labor Day

To add equity data to the national dialogue about growth and prosperity, every week the National Equity Atlas team posts a new chart drawing from the Equity Atlas related to current events and issues.

In honor of #LaborDay and the #Fightfor15, this week’s chart looks at the share of workers earning at least $15/hour in California. In an equitable economy, all workers would earn enough to support their family, or a “living wage.” What constitutes a living wage varies based on family size, but $15/hour is a good benchmark for understanding which groups are least likely to be earning a living wage. The fight for a $15/hour minimum wage is also an important campaign that continues to gain momentum.

In California, among full-time workers ages 25 to 64, Latinos are the least likely to make at least $15/hour. 49 percent of Latino women and 54 percent of Latino men earned at least $15/hour in 2012 compared with 81 percent of White women and 87 percent of White men. Latinos are the single largest ethnic group in California, but they continue to face some of the steepest barriers to economic inclusion.

Low wages among the growing Latino population is bad for families and bad for California’s economy: more money in the hands of workers means greater demand for goods and services. Research shows that companies can pay living wages and remain profitable, in part because paying higher wages reduces turnover and increases productivity.

Thanks to policy changes, we should soon see positive changes on this indicator. The minimum wage in California is currently $10/hour, but earlier this year, state lawmakers struck a deal to gradually raise the state minimum wage to $15/hour by 2022.

To see how the share of workers earning at least $15/hour varies by race/ethnicity and gender in your community, visit the National Equity Atlas, type in your city, region, or state, and select the “By gender” breakdown. Download and tweet at us the chart for your community using #equitydata and #Fightfor15.

Siphoning Off the Safety Net: How Social Services Agencies are Squeezing Revenue from the Poor and Vulnerable People They’re Meant to Serve

As seen in Stanford Social Innovation Review’s Fall 2016 issue

Revenue schemes that target the poor are not confined to a few jurisdictions or to the justice system. Rather, as Daniel Hatcher documents in his important new book, The Poverty Industry, states and municipalities across the country, working with private contractors, have turned a range of vulnerable populations into sources of income for cash-strapped agencies, general government funds, and corporate coffers. Motivated in part by severe funding cuts, agencies in red states and blue states alike divert money intended to help abused and neglected children, disabled youth, the elderly poor, and impoverished families; state contractors use sophisticated analytics to determine how to squeeze even more dollars from them. “[A]s policy experts across the political spectrum debate the best structure for government aid programs, a massive siphoning of the safety net is occurring behind the scenes,” Hatcher writes. These practices are increasing even in the face of civil rights concerns, lawsuits, and multimillion- dollar fraud settlements.

Read the full review>>>

Community Artists Envision a Thriving Baltimore without Displacement

"Robust, democratically controlled community-based organizations have the capacity to drive development locally," said Greg Sawtell, a leadership organizer at Baltimore's United Workers. The human rights organization is gearing up for a month-long exhibition of the community's multiple visions for local development, opening in September. The Development Without Displacement art show will highlight works focusing on neighborhood revitalization efforts that aim to protect the city's vulnerable low-income residents from displacement, eviction, and alienation.

United Workers' arts and culture projects are intertwined with their campaigns: the projects are tools to critically engage with issues of housing, labor, and environmental injustice and draw attention to the lived experience of locals. "The arts — in the form of music, painting, storytelling, and more — are a strength that we have on the ground," said Sawtell. "We've used art both to shine a light on untold stories, and as a way to ignite the collective imagination to think beyond what seems possible in the everyday."

Free Your Voice and the fight against an incinerator

One of United Workers' most successful and well-publicized recent campaigns was an effort to block the building of a trash-to-energy incinerator in the Curtis Bay neighborhood of South Baltimore. Proposed in 2010, the 90-acre site was planned to house a plant that would burn 4,000 tons of trash a day. The complex would have been less than a mile from two public schools, in a neighborhood already beset by multiple toxic pollution burdens.

The anti-incinerator campaign was largely youth-led, spearheaded by one of United Workers' human rights committees, Free Your Voice. Young people conducted research about the impacts of the incinerator, canvassed neighborhoods to disseminate information about the plans, and organized protests and events. The students discovered that Baltimore City Public Schools (BCPS), other city government agencies, and local entities — including several arts-based institutions — had signed contracts to purchase energy from the proposed incinerator. Students launched a divestment campaign to put pressure on these entities to demonstrate their commitment to environmental justice and equitable development. Sisters Audrey and Leah Rozier wrote and performed the song "Free Your Voice" for the Baltimore City School Board in 2014, singing: "It'll all get better/We can save the world/And it starts with music/Get your message heard."

In 2015, BCPS and the Baltimore City Board of Estimates terminated their contracts with the incinerator developer, Energy Answers. In spring 2016, the Maryland Department of the Environment and the Public Service Commission both declared the incinerator's permit to be invalid, halting the project indefinitely. For her leadership in the campaign, high school student Destiny Watford became the 2016 North American winner of the Goldman Environmental Prize, which honors grassroots environmental activists.

Sawtell said that local residents initially supported Free Your Voice as a nice research project and leadership development activity, but didn't have much faith that young people would be able to stop the construction of the incinerator. "Those weren't cynical adults," he explained, "Those were people who felt like they were managing the expectations of young people. Free Your Voice went from hearing those responses to their efforts to steadily building power and a campaign, and now this is recognized as one of the most successful environmental justice campaigns currently in Maryland."

Read more in the August 18th America's Tomorrow newsletter>>>

Latino Immigrants Face an Uphill Battle to Economic Inclusion

This blog post by Angel Ross was first published on the National Equity Atlas August 9, 2016.

Immigrants have been an integral part of the social, political, and economic fabric of this nation since its inception. But increasingly hostile local, state, and national policies and climates put many immigrants in precarious situations, restricting both their participation and potential, and ultimately hurting the economy as a whole.

In June, we released data on working poverty in the Atlas, and found the number of Latinos working full-time yet still struggling economically has increased steadily over the last three decades. Last week, we added breakdowns on immigrant status to eight Atlas indicators, including working poverty. This new data reveals the significant challenges of working poverty among Latino immigrants and the vast differences within the Latino immigrant and U.S.-born populations. For instance, nationwide Latino immigrants are twice as likely as U.S.-born Latinos to be working poor.

This analysis describes working poverty among Latino immigrants, examines the cities with the worst outcomes on this indicator, and highlights policies to support immigrant integration and ensure economic security.

Employed Latino immigrants have higher poverty rates than U.S.-born Latinos

One in four Latino immigrants between the ages of 25 and 64 is working full-time but has a family income below 200% of the federal poverty level, compared with just 12 percent of U.S.-born Latinos. Mexican immigrants, who account for more than half of all Latino immigrants, have the highest overall rate of working poverty among Latinos at nearly 29 percent followed by Guatemalans (28 percent) and Hondurans (26 percent). 

Multiple factors contribute to these numbers. In addition to lower wages and lower levels of educational attainment on average, another important reason is that immigrants, half of whom are Latino, are less likely to be enrolled in public benefits programs. Poverty is calculated based on family income, which includes earnings as well as sources other than work like the Supplemental Nutrition Assistance Program (SNAP) and Temporary Assistance for Needy Families (TANF). Undocumented people are currently ineligible for many of these programs, but we see lower rates of enrollment even among eligible immigrant families. Increasing enrollment in these programs is one way to ease the burden that many low-income immigrant families face in the U.S.

Many immigrants are also part of mixed status families, which might include authorized immigrants, undocumented immigrants, and U.S. citizens. By 2010, close to a quarter of all children had at least one immigrant parent. But due to the precarious status of undocumented workers and discrimination against Latino immigrants, exploitation and wage theft is rampant.

The high rates of working poverty among working-age Latino immigrants translates into high levels of economic insecurity among Latino children, who are a large and growing segment of our future workforce. Nearly 63 percent of Latinos under 18 years old live below 200 percent of poverty as do two in three Latino children under 5 years old.

Where do Latino immigrants face the biggest barriers?

To better understand the geography of economic insecurity among Latino immigrants, we ranked the 100 largest cities in the U.S. by the rate of working poverty and the median wage among Latino immigrants. Because both citizenship and education are associated with higher earnings, we also looked at the citizenship rate and the percent without a high school diploma.

The cities with the highest levels of working poverty among Latino immigrants—with 38 to 40 percent of their Latino immigrants working poor—included the North Carolina cities of Winston-Salem and Greensboro, along with the Texas cities of Dallas and Irving, followed by Minneapolis, Minnesota. These cities also had lower median wages, lower levels of citizenship, and lower levels of educational attainment than Latino immigrants nationally. The national citizenship rate of all Latino immigrants, for example, is 30 percent and the median wage for full-time workers is $12.70/hour. Yet the citizenship rate among the five cities with the highest levels of working poverty ranged from 11 percent in Winston-Salem and Greensboro to 19 percent in Irving. The median wage ranged from $9.40/hour in Winston-Salem to $10.70/hour in Dallas. Similarly, just under half of Latino immigrants nationally lack a high school diploma, but that number goes as high as 68 percent in Dallas.

The cities with the lowest median wages among Latino immigrants—ranging from just $8.90/hour to $10.20/hour—are Raleigh and Winston-Salem, North Carolina, Indianapolis, IN, Plano, TX, and Columbus, OH. Indianapolis has the third lowest median wage but a significantly lower rate of working poverty than other cities. The wage difference in Irving and Plano, Texas show the extent to which labor markets are truly local: the median wage is more than a dollar lower in Plano than in Irving or Dallas even though both are part of the Dallas metropolitan area and educational attainment is higher in Plano. Importantly, Latino immigrants as a whole account for a much smaller share of the total population in Plano than in Irving (7 percent in Plano versus 20 percent in Irving).

Winston-Salem, NC is the only city ranking both in the top five on working poverty and in the bottom five on median wages. With roughly 36,000 Latinos, 20,000 of whom are immigrants, Winston-Salem is home to the largest share of Latinos out of all big cities in North Carolina while neighboring Greensboro has one of the smallest shares of Latinos. Yet in both cities, Latino immigrants face significant barriers to economic inclusion. Four in ten Latino immigrants ages 25 to 64 in Winston-Salem and Greensboro are working poor and half earn less than $9.50/hour in Winston-Salem and $10/hour in Greensboro.

Latino immigrants in the capital of North Carolina at the heart of the Research Triangle (anchored by North Carolina State University, Duke University, and University of North Carolina at Chapel Hill) have the lowest median wage for full-time workers of the largest 100 cities and even the largest 150 metropolitan areas in the country. With more than half of Latino immigrants in Raleigh earning less than $9/hour, combining the income of two working parents still doesn’t add up to a living wage for a family of three or four. Latino immigrants are more than three times as likely as U.S.-born Latinos in Raleigh to be working poor.

Interestingly, the median wage of Latino immigrants in Durham, also in the Research Triangle, is nearly $3/hour higher than in Raleigh even though a higher percentage of Latino immigrants in Durham lack a HS diploma and the citizenship rates in both cities are nearly identical. The Latino population also accounts for roughly the same share of the population in both cities, but Durham is majority people of color and Raleigh is majority White. Despite the higher median wage, 29 percent of Latino immigrants in Durham are working poor.

Municipal IDs and the state preemption of local policies benefiting immigrants

The North Carolina economy relies on immigrant labor, but last year Governor Pat McCrory signed a bill banning local governments from establishing “sanctuary cities” and preventing government agencies from accepting local or foreign-issued IDs. The mayor of Greensboro viewed this legislation as targeted towards their local efforts to welcome immigrants with one of the first programs in the South that offered ID cards to immigrants. Law enforcement officials successfully pushed back last year and the law only bars city officials from accepting the ID cards, not police or hospitals.

But this year, new legislation was introduced in the state that would prohibit law enforcement from accepting municipal IDs. This law was passed in spite of evidence that local ID cards help to foster a sense of community among all residents and that law enforcement has actually solved more cases due to increased trust from the undocumented community. This type of state preemption to local authority is a threat to equitable development, but continues to gain momentum across the country, particularly in more conservative states, curbing the ability of local leaders to build inclusive and equitable cities.

Immigrant integration is a moral and economic imperative

In an increasingly hostile political environment, one promising strategy for immigrant integration is increasing naturalization. Not only does naturalization strengthen democracy through voter representation, it also results in economic gains. A recent study by our partners at the Center for the Study of Immigrant Integration found that reducing the eligible to naturalize population by half over 5 years is estimated to result in a $75 billion gain to the national economy over ten years. Ending the criminalization of undocumented immigrants by providing a pathway to citizenship and increasing citizenship supports for authorized immigrants has benefits extending far beyond the immigrant population.

In additional to municipal ID cards, other state and local strategies include providing access to health care for undocumented people, as SB 10 did in California, and separating local policing from immigration enforcement as HB 13-1258 did in Colorado. Policies that contribute to the just and fair inclusion of those residents who are often left behind help to create thriving and sustainable communities. To learn more about these policies, visit our immigrant contribution to growth indicator.

To explore data on immigrants for your city, region or state, visit the National Equity Atlas. For more information on the nativity cuts, see our previous blog.

Using the 2015 DataHaven Community Wellbeing Survey to Understand Neighborhood Equity and Unify Cross-Sector Partners

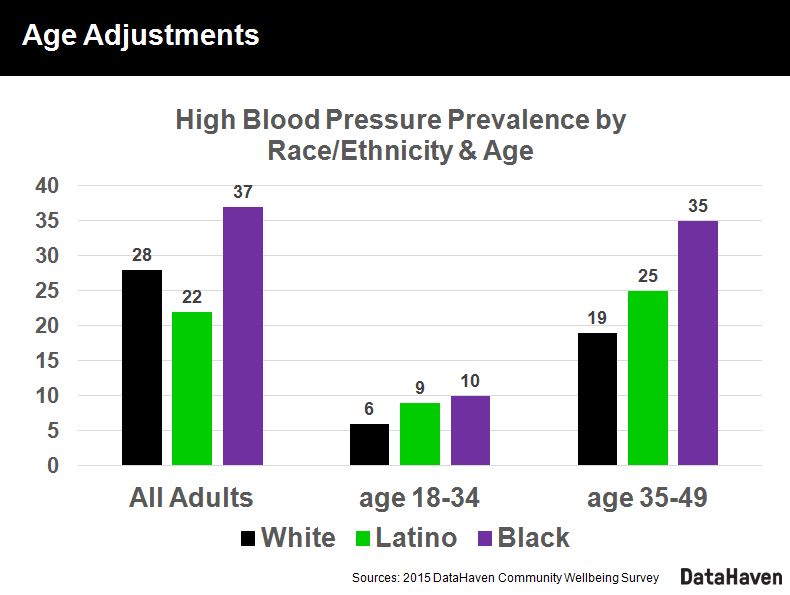
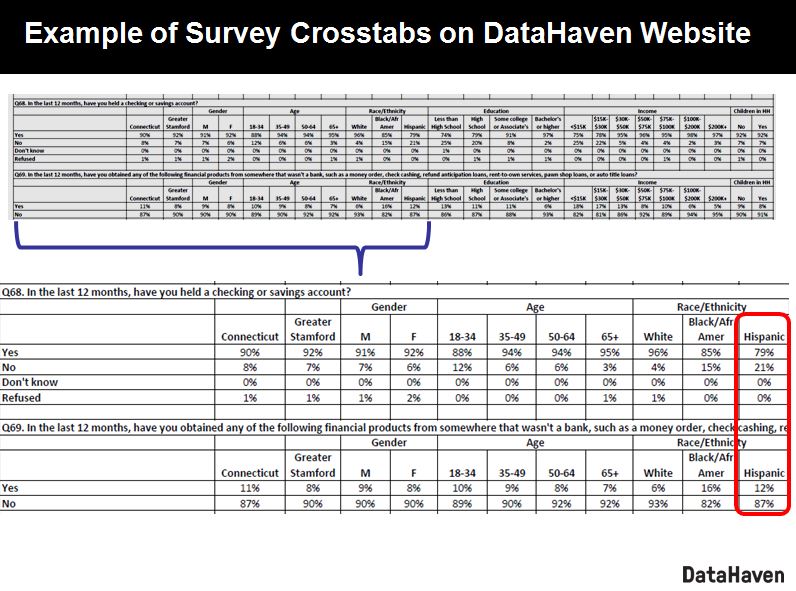
Twenty-eight percent of adults who identify as non-Hispanic white in Connecticut report that they experience high blood pressure, compared to twenty-two percent of adults who identify as Latino, according to DataHaven’s 2015 Community Wellbeing Survey. This statistic suggests that for this health measure, Latinos fare better than their white counterparts.

However, the median age of white adults is more than a decade higher than the median age for Latinos in Connecticut. If you examine age-specific rates comparing whites and Latinos within the same age groups, Latinos experience high blood pressure at significantly higher rates.


This is just one example of the importance of breaking down data by age, race and ethnicity, neighborhood, income, and other factors. By providing community profiles, crosstabs, and public reports of the data collected from its Community Wellbeing Survey as well as other sources, DataHaven and its partners aim to emphasize why examining local data at multiple levels is necessary to making accurate, informed policy decisions that improve well-being and overall quality of life.

Well-being measurement as a unifier

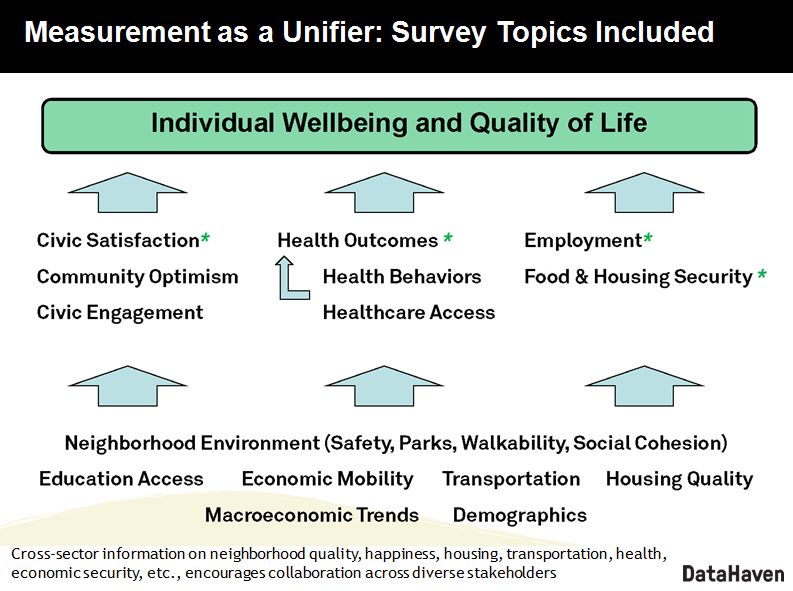
The DataHaven survey supports organizations working across different issue sectors, allowing them to understand how issues such as employment, financial stress, health, transportation, and neighborhood quality are related to one another. 

To facilitate this, the survey includes a series of questions designed to measure happiness, physical and mental health, and life satisfaction – also known as experienced and evaluative well-being – that were based on well-known international surveys. 

These desired “well-being outcomes” are presumably shared by all people working to improve quality of life within an area; measuring them is a way to show how such efforts are interconnected as well as helping to reveal some of the largest barriers to individual well-being. 

According to our analyses, some of the barriers that stand out include a lack of social or community support, inability to afford needed health care, under-employment, and food insecurity.

According to Anita Chandra, Director of RAND Infrastructure, Justice, and Environment, one of the advisors on the development of the survey, the DataHaven Community Wellbeing Survey “gives you a picture on how residents are doing across the state and in neighborhoods specifically, which can help community leaders plan. It really provides a holistic understanding of quality of life, which we know matters, not only in the immediate but over the long term. Capturing things like how do people perceive their community, how do they relate to each other, in addition to economic indicators that are more traditional, really gives us a better sense of not only individual well-being but community well-being, and that is important for ongoing policy and program development.”

Developing a statewide, cross-sector survey on neighborhood well-being

One goal of the DataHaven Community Wellbeing Survey is to develop robust information on individual- and neighborhood-level well-being that was previously unavailable at the local or even state level.  More than 16,000 randomly-selected residents throughout Connecticut participated in in-depth cell phone and landline interviews, providing local partners with information on a range of issues that in many cases can be disaggregated at the local level.

In planning the survey, we were inspired by words of Angela Glover Blackwell, the CEO of PolicyLink, who said at a 2014 OECD/Ford Foundation event, “if you want to achieve an equitable outcome, it starts with disaggregated data. We need to have the courage to look within ourselves and see who is, and who isn't, doing well."

The survey program grows out of a need to unify data collection on social and economic issues throughout Connecticut.  DataHaven and a panel of survey research experts began by considering results from more than a dozen local-level surveys conducted throughout Connecticut in recent years, including others by DataHaven, as well as dozens of national surveys. Based on previous studies done elsewhere in the US and significant input from local and national experts, DataHaven developed the questionnaire to serve as a uniform tool for a variety of organizations.

This survey was made possible through the direct support of more than 50 partner organizations and funders, including community foundations, non-profit hospitals, colleges and universities, local public health departments, and other state or regional agencies. Adult participants were recruited by landline and cell phone, and then participated in live interviews in English and Spanish with staff of the Siena College Research Institute. Data was weighted to represent populations in each area, and sample sizes were scaled to match populations in large, midsize, and small cities and towns with all 169 towns included.

Breaking down the data by neighborhood and demographic group

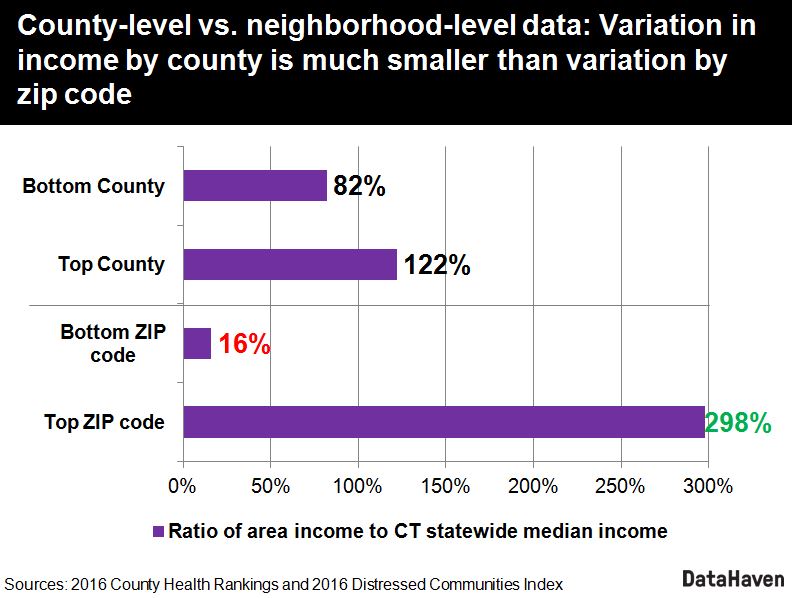
There are differences in median income or health status across counties, but these differences are much more striking when comparing zip codes or neighborhoods within the state’s urban centers and wealthier towns. The survey results highlight the need for better disaggregation of data at a local level, where we see much of the variation occur.

Since the survey was designed to look at neighborhoods, we prioritized neighborhood-level questions on community resilience – such as about the environment surrounding people’s homes. Assets like sidewalks, safe neighborhoods, stores, and parks were among the questions that we felt were important. Survey responses confirmed the importance of these assets – with walkability scales varying widely across different types of built environments.

Additionally, we often expect to see differences in well-being across income level. For example, higher income residents are more likely to report that their neighborhood is a good place to raise children. However, the survey allows us to dig deeper and include the effects of neighborhoods themselves.

Splitting this question on age-friendliness by zip codes’ distress levels, we see that neighborhood conditions are a much better predictor of a participant’s answer to this question than their income.  Residents in the state’s highly-distressed zip codes, which are primarily in the city centers of Bridgeport, Waterbury, and Hartford, have similar answers regardless of their household income.

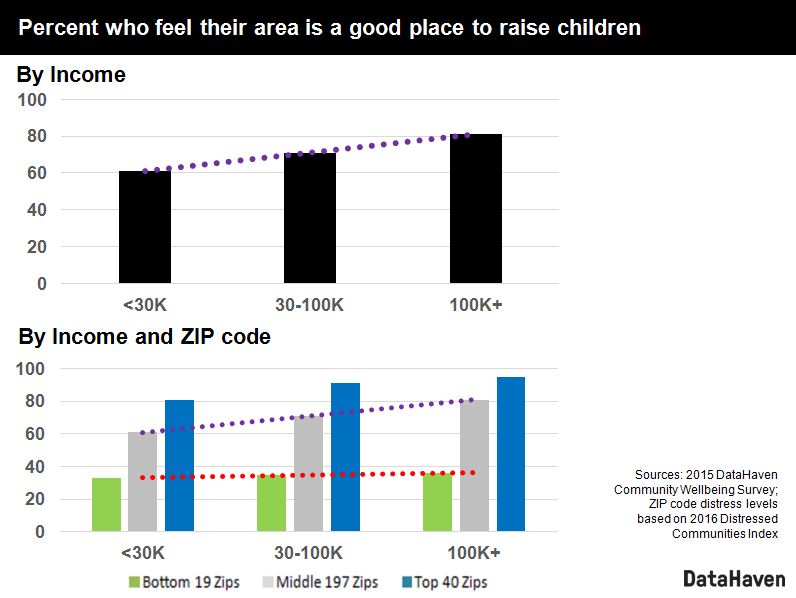
This speaks to the importance of disaggregating data at a neighborhood level, especially to understand community context and plan appropriate interventions.

We also see differences when disaggregating by both race/ethnicity and age, as previously mentioned. This is particularly important because the median age of white residents is more than a decade older than that of Latino residents. Calculating differences across age groups is essential to producing a valid picture of community well-being.

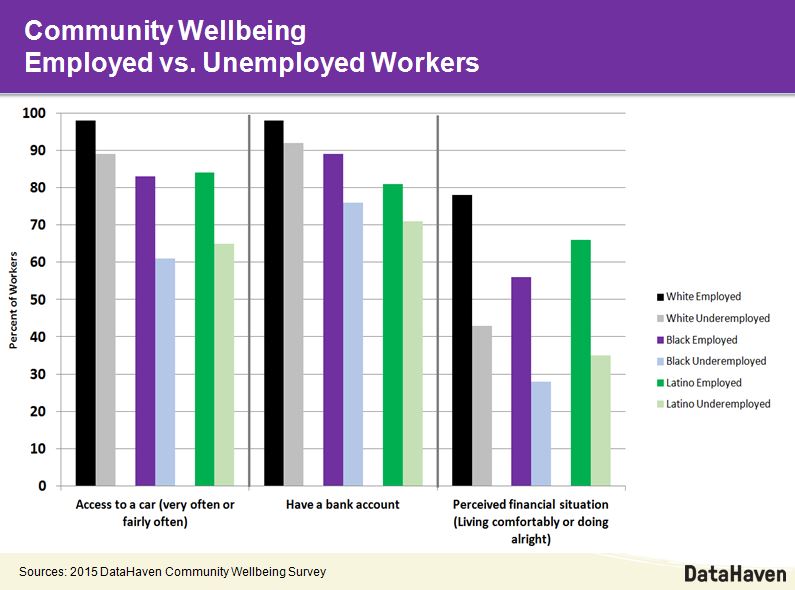
Similarly, we get a more complete picture of both personal and community well-being when we split participants into groups like food insecure versus secure; employed, unemployed, and underemployed; or commute time. For many questions, these groupings—in combination with other demographic factors—tell us much more than income level alone.

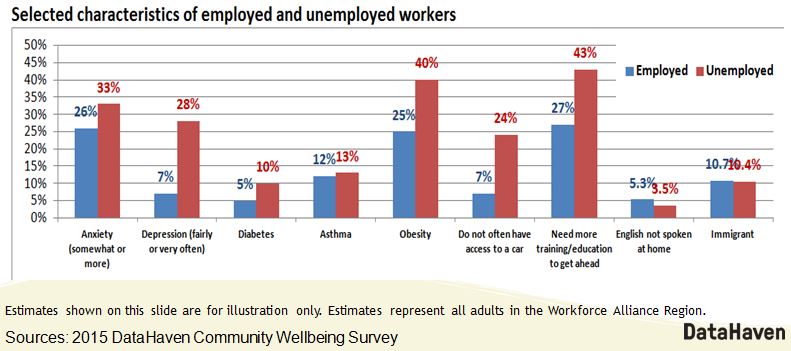
With some of these alternative groupings, we can identify differences in access to resources, such as cars, banking, and internet access, that may help organizations and policymakers better understand and target residents’ needs or justify changes in policies that support families.

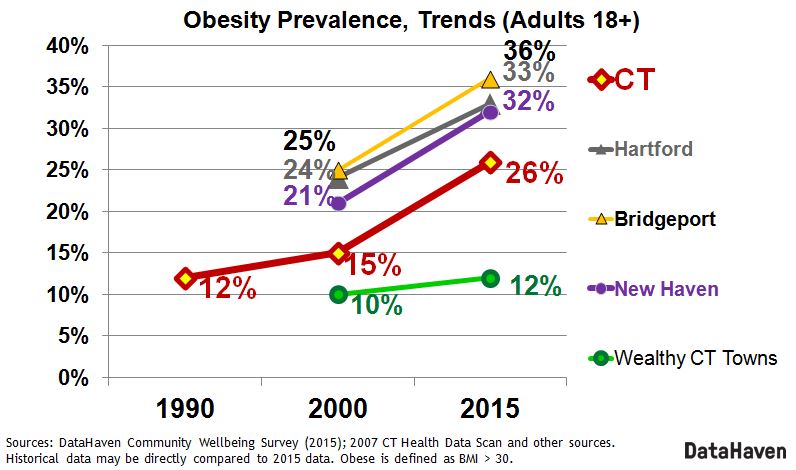
Using consistent questions in multiple survey efforts allows us to measure changes over time as well. For example, obesity prevalence has increased statewide since 1990, but at different rates based on location. Obesity rates stayed steady in wealthy towns, while rising sharply in other parts of the state.  

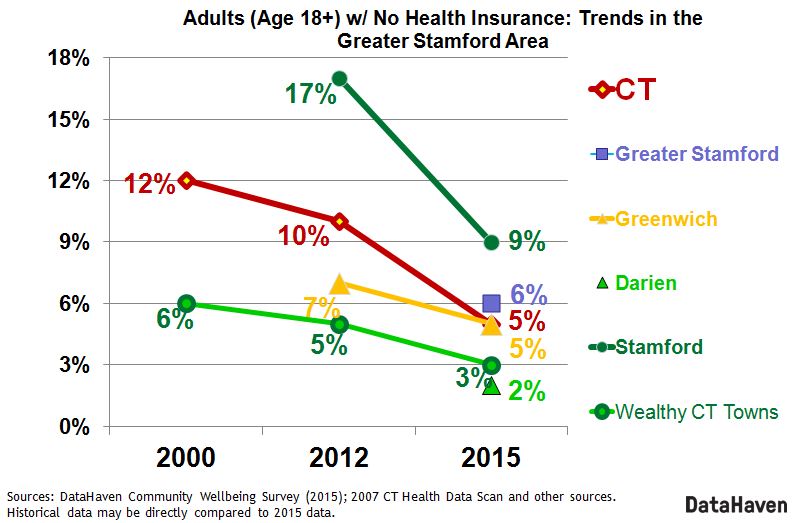
Looking at trends over time within regions, we see wealthier towns are also less likely to smoke regularly. Similarly, while rates of adults lacking health insurance have gone down statewide, we still see rates are high within areas with large populations of immigrants.

We also found differences by location within regions and cities. We compared measures between neighborhoods in large cities, and in some cases mapped data by zip code. Within all regions throughout the state, we found stark differences in a series of health care measures when comparing low-income residents to high-income residents.

Residents in wealthy towns are more likely to have positive opinions on health-promoting community resources, such as the conditions of parks, access to services, and neighborhood safety.  At the same time, the survey shows that the most distressed neighborhoods also contain many assets that support community resilience, including walkable sidewalks, bike lanes, cultural activities, and involved neighbors.

Accessing survey resources

On our website, we host resources such as reports and survey crosstabs; we also have developed community profiles for towns and neighborhoods. In the crosstabs, we make available regional and town-level estimates for every question broken down by demographic groups, income, and education, along with guidance for using the tables. Other organizations throughout Connecticut and beyond are making extensive use of the data, and may contact us with any questions.

By working closely with dozens of other organizations throughout Connecticut, we are releasing reports and neighborhood tools based on the survey data and other state and federal data sources.  These include several of our own comprehensive community indicator reports focused on the Fairfield County and Greater New Haven areas, that will serve a double purpose as Community Health Needs Assessments for non-profit hospitals and health departments in these regions.  We are also building partnerships with media organizations and universities, and providing ongoing technical assistance to non-profit organizations and government agencies throughout the state. We encourage other organizations to use or build upon the survey to better understand local communities’ trends and needs.

DataHaven encourages interested parties to reach out to suggest topics or questions that should be included in the future. We were cautious on this survey to not duplicate other efforts; but designed it in a way that would complement other sources of information that already exist.

A webinar with more information on the DataHaven Community Wellbeing Survey is available on the Public Health Foundation’s TRAIN national website, made possible with a grant from The Robert Wood Johnson Foundation and funding from participating states and the Centers for Disease Control and Prevention.

Now on the National Equity Atlas: Nativity Cuts Added to Eight Indicators

From the high-skilled workers who contribute to groundbreaking research and innovation, to day laborers who are the backbone of the economy, immigrants have played a critical role in positioning the U.S. as a world leader on many fronts. In a context of increasing xenophobic sentiment, understanding the economic engine that is the immigrant population in the U.S. and ensuring immigrant integration is an important cultural, political, and economic imperative.

Understanding the characteristics of the local immigrant community is critical to developing effective strategies to help newcomers reach their potential, and that is why we added new nativity breakdowns to eight economic opportunity indicators in the National Equity Atlas: median wage, unemployment, the percentage of workers making $15/hour, disconnected youth, homeownership, educational attainment, poverty, and working poor. With these breakdowns, you can find out how immigrants are faring in the largest 100 cities, largest 150 metros, and all 50 states.

This is a treasure trove of data for you to explore. Below, we describe a few highlights from our own review of this new data.

An overview of the 40 million immigrants in the U.S.

There are 39.8 million immigrants in the U.S., representing 13 percent of the total population. Latinos make up nearly half (47 percent) of the immigrant population followed by Asians and Pacific Islanders (API) who account for another 25 percent. This is a testament to the growing body of Latinos and APIs residing in the U.S. White and Black immigrants follow at 19 and 7 percent respectively.

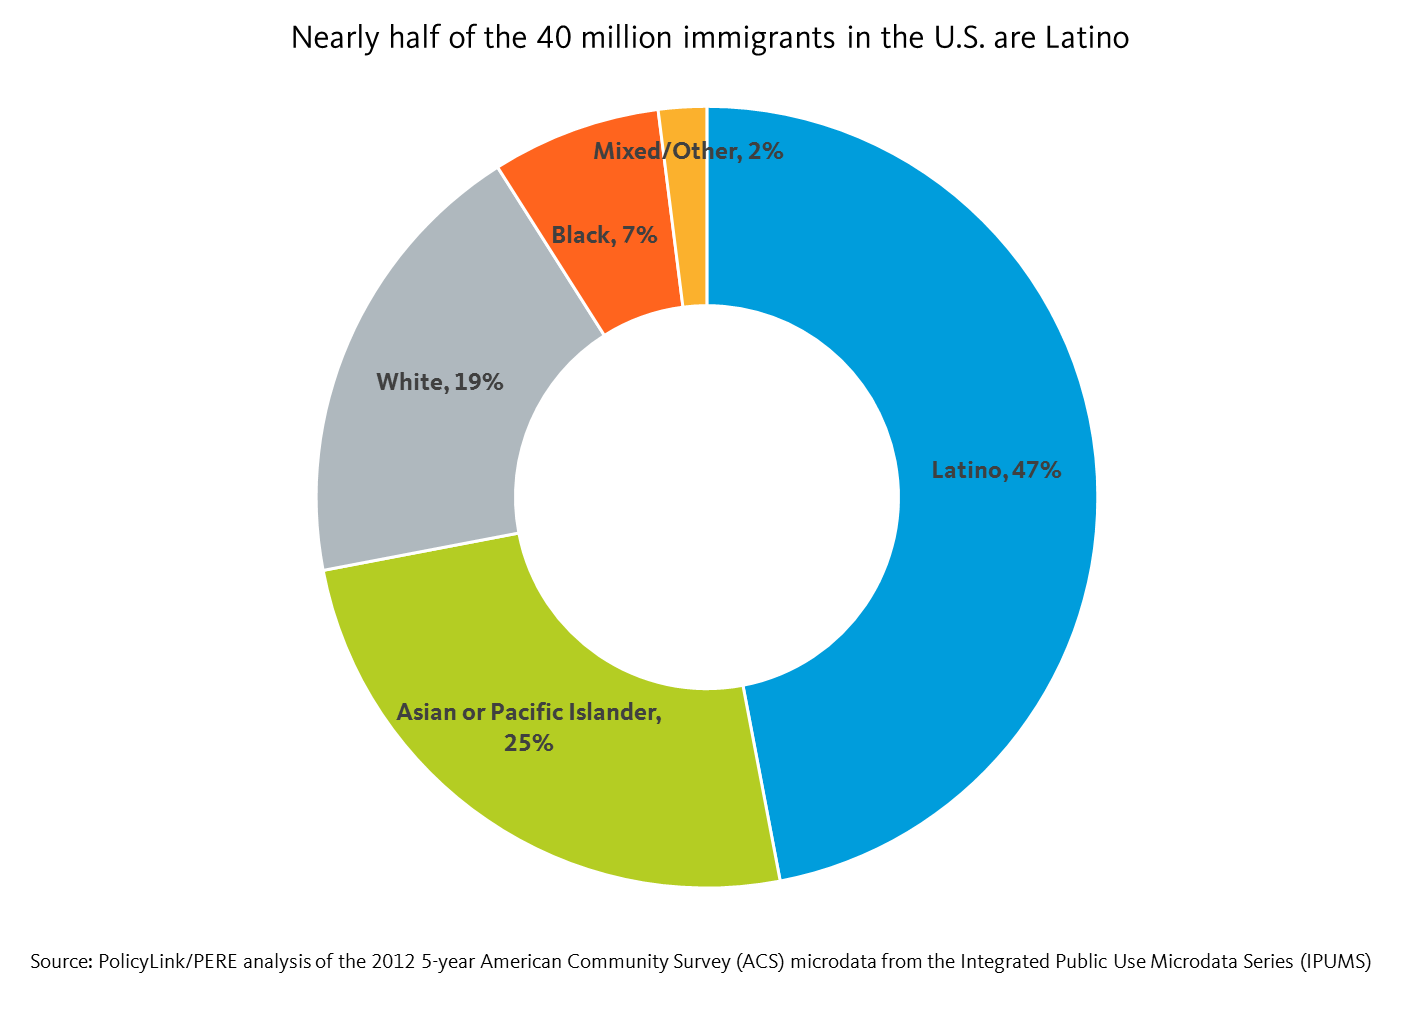
Latino immigrants made up 3 percent of the total U.S. population in 1990, a figure that doubled to 6 percent by 2012. Latino immigrants represent not only the largest share of immigrants in the U.S., but also the fastest growing. The API immigrant community is the second fastest growing and represent 3 percent of the total U.S. population as of 2012. White immigration has more or less stayed stagnant at 3 percent between 1990 and 2012. Finally, Black immigrants make up the smallest share of the total U.S. population at 1 percent, and are not growing as fast as their Latino and API immigrant counterparts.

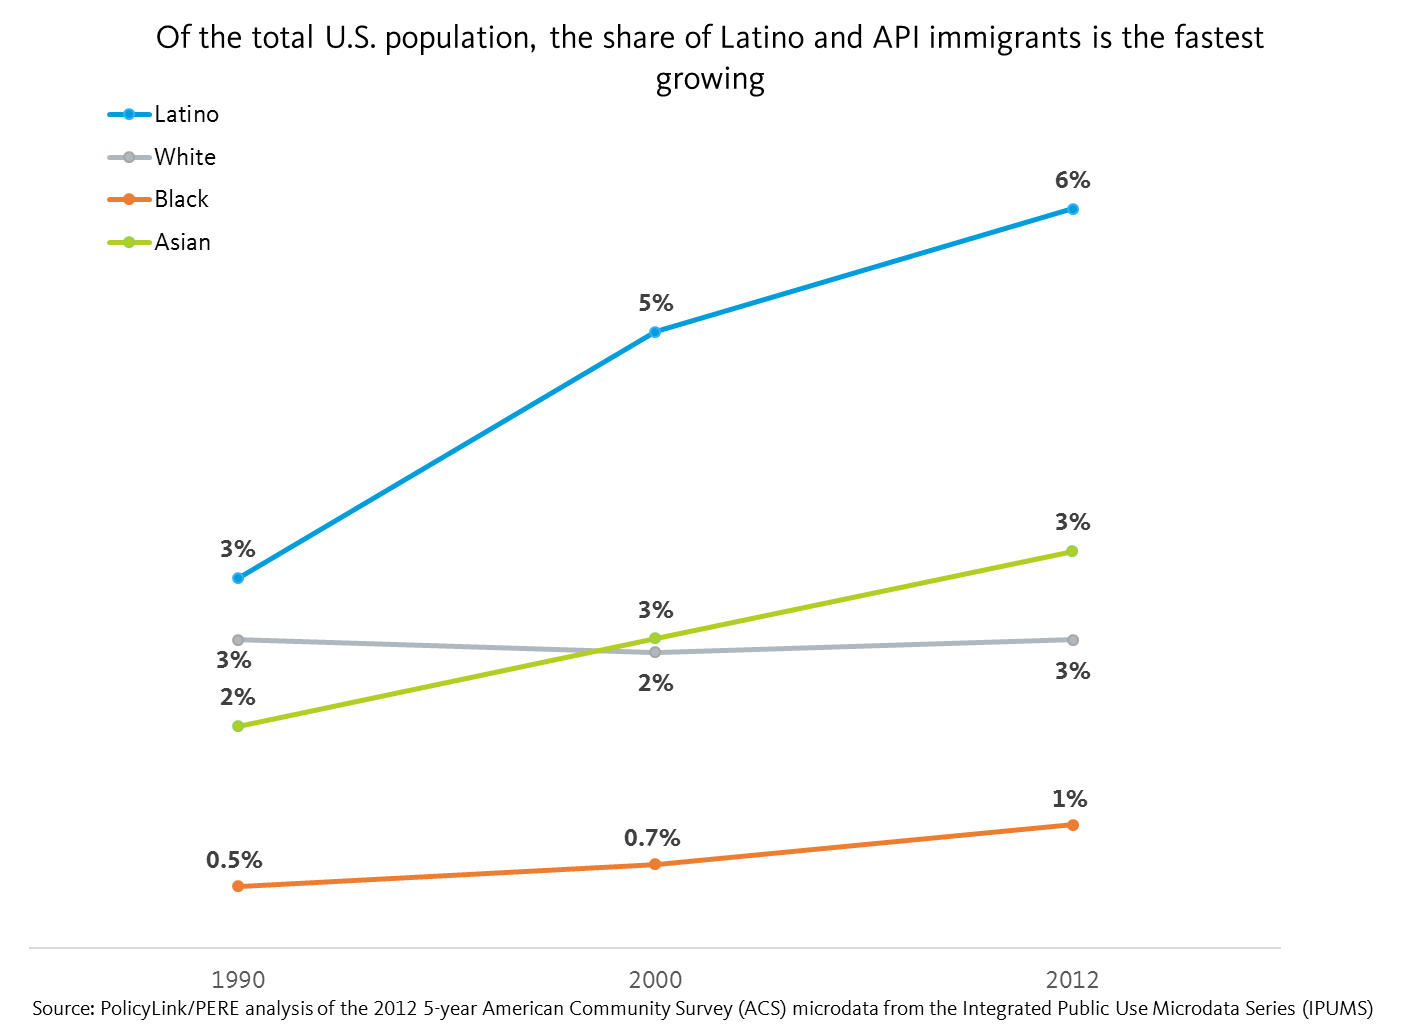
Despite their numbers, Latino immigrants face some of the largest barriers to inclusion. For example, they have the lowest median wage at less than $13/hour, which is $5/hour less than U.S.-born Latinos and half the median wage of White immigrants. Furthermore, 57 percent of Latino immigrants are living under 200 percent of poverty, and 25 percent are working poor.

Black and White immigrants report higher levels of education than their U.S.-born counterparts

The new nativity cuts also allow for a within-group analysis that sheds light on how immigrants and U.S.-born people of the same race fare in comparison with one another.

For instance, using education as an example, we can see that higher rates of White and Black immigrants report having a BA or higher when compared with their U.S.-born counterparts. But the opposite is true for Latino and API immigrants: they are less likely than their U.S.-born counterparts to have a BA or higher.

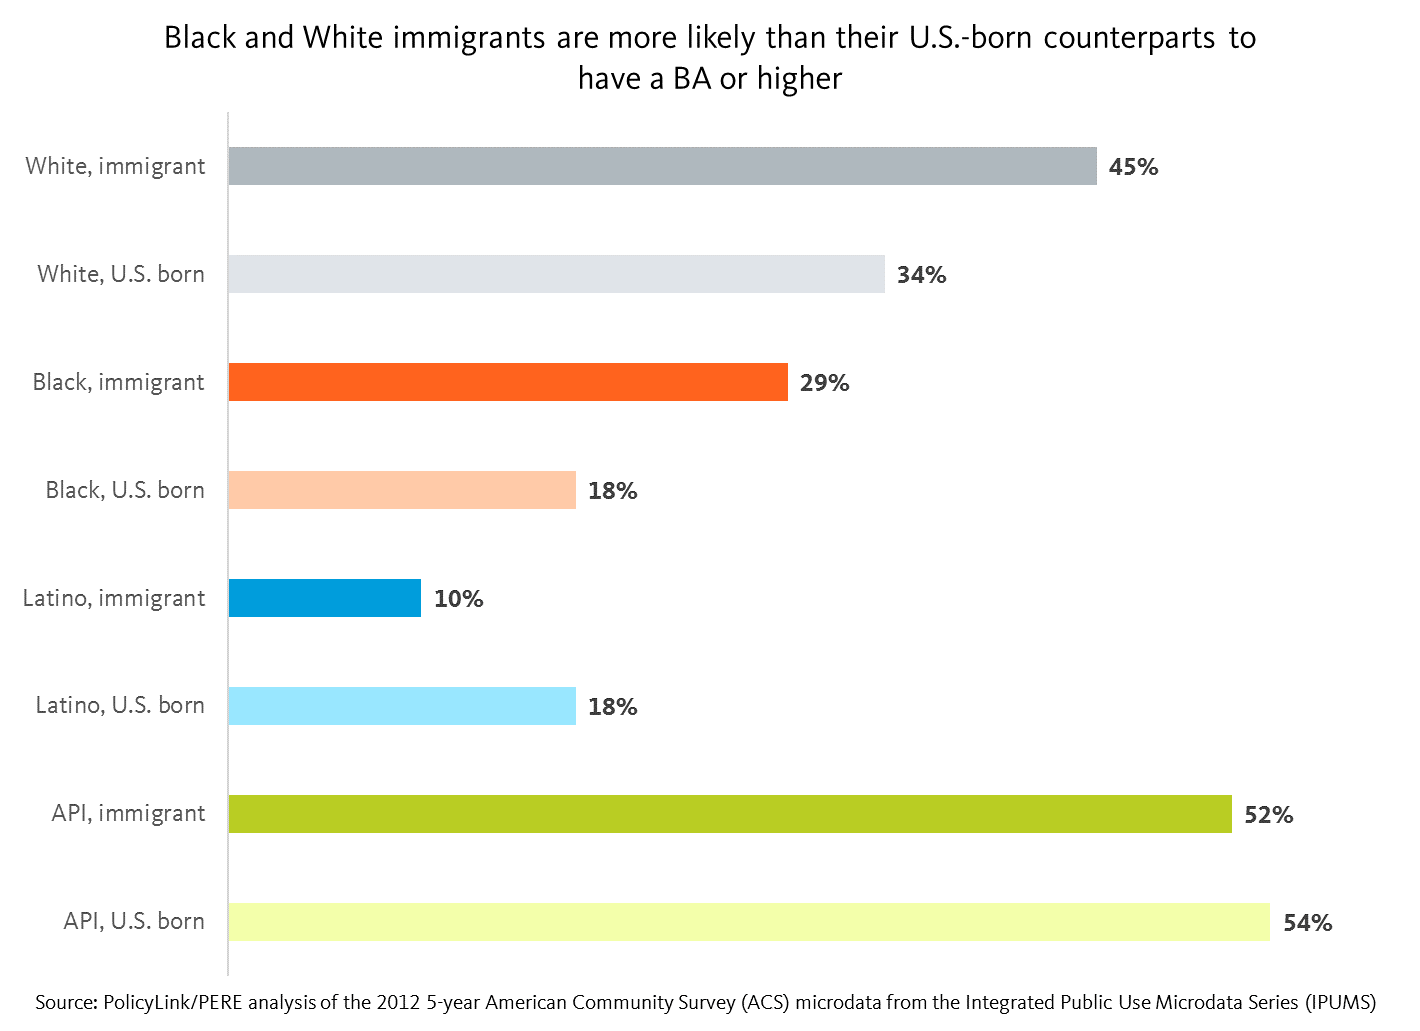
We can do a deeper with-in group analysis by looking at the disaggregated ancestry subgroup data by the nativity cuts. For instance, using median wage as an example, immigrant Whites as a whole earn more than U.S. born Whites. Looking at the disaggregated ancestry subgroup data by nativity cuts reveals the following: immigrant Whites of Western European and North American ancestry reported lower median wages than their U.S. born counterparts, but immigrant Whites of Eastern European ancestry reported higher median wages than their U.S. born counterparts. On the other hand, immigrant and U.S. born Whites of Middle Eastern/North African ancestry reported the narrowest gap with respect to the disparity in their reported median wages.

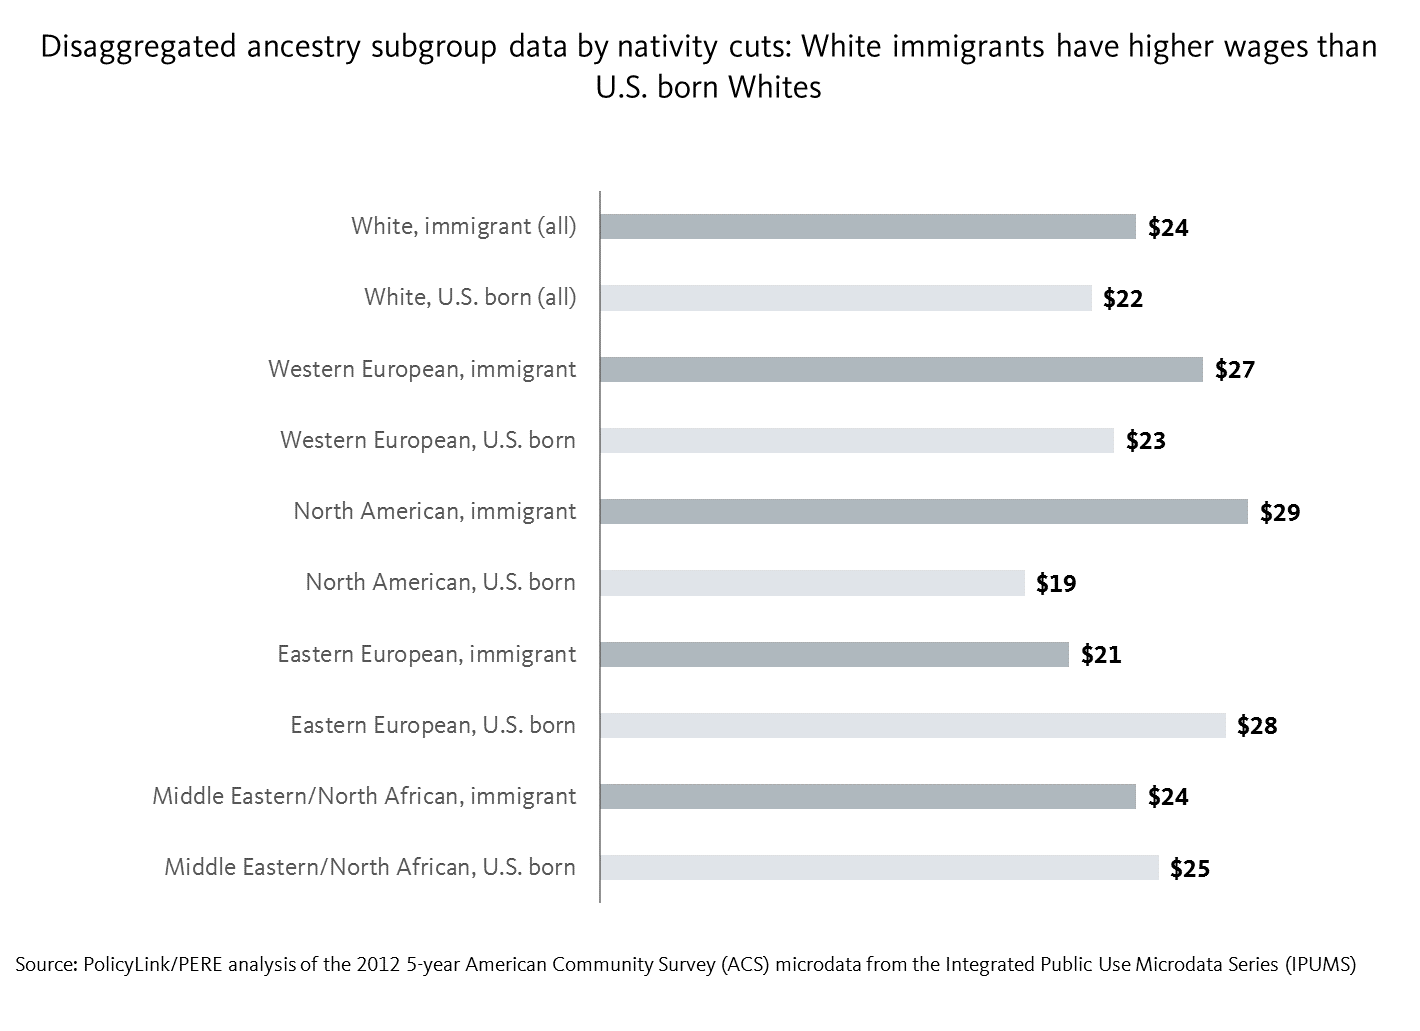
Studies show the significant economic contributions of Latino immigrants

In addition to the rich diversity and culture that immigrants bring to this country, studies show that immigrants continue to play a critical role in driving economic growth in their communities. According to a recent study by economists Dennis Coates and T.H. Gindling, “income growth that tends to accompany Latino population growth in rural counties is even greater where native-born, non-Hispanic populations have otherwise been shrinking”.  

This study shows that immigrant spending in Nebraska generated up to $2.4 billion worth of output, in which the Latino immigrant community contributed up to $1.1 billion. There is a similar story in Iowa of Latino immigrant spending reaching up to $963 million of the estimated $2.5 to $3.2 billion in immigrant spending. Furthermore, the study found that the absence of Latino immigrants in the Omaha-Council Bluffs economy would lead to a 7.8 percent reduction in total production – an amount that translates to $6.5 billion.

Immigrant integration is an economic and moral imperative

Removing barriers to immigrant participation in the economy is key to a thriving and prosperous economy. The California Immigrant Policy Center, based in the state that is home to the largest population of immigrants, has policy priorities for 2016 ranging from access to health care to workers’ rights. Such advocacy efforts are crucial to ensure the socioeconomic inclusion of the immigrant community that has historically played an integral part in the making of a nation.

To access the data for your city, region, or state, go to nationalequityatlas.org, click on Indicators, and in the Equity menu, select one of the eight indicators listed above. On the indicator page, choose the “By nativity” breakdown to see the nativity cuts. Additionally, if you click on the “By ancestry” breakdown, a nativity filter appears below the graphic display that allows you to look at the data for U.S.-born people or immigrants.

$65 Million Reasons to Stop Roadblocking City-Driven Job Creation

Orignal post published in Next City

In the last year, city officials in New Orleans, Cleveland and Nashville have found themselves scrambling to protect “hire local” policies from their respective state governments.

In all three cases, racially diverse cities struggling with high rates of poverty and unemployment sought to stimulate the local economy with provisions that focused on creating job opportunities for disadvantaged residents. And in all three cases, state senators representing wealthier, predominantly white districts sought to preempt city policies to protect business interests.

Read full article >>

“What Do You Need to Employ Rochester’s Low-Income Residents?”: A Conversation with Mayor Lovely Warren

Like many cities across America, Rochester, New York, is a city of striking economic and social contrasts: inside the city limits the population is 62 percent people of color, while the metro area is 66 percent White. According to the National Equity Atlas, 20 percent of students of color within the city attend high-poverty schools compared with 2 percent of White students, and more than 40 percent of Blacks and Latinos live in the city’s high-poverty neighborhoods compared with 10 percent of Whites.

Rochester’s Mayor Lovely A. Warren has made alleviating poverty in neighborhoods a priority in her administration. Many of the programs she has spearheaded have focused on building community wealth. One effort, the Market Driven Community Co-op Corporation, is seeking to create a network of worker-owned cooperatives overseen and coordinated by the Democracy CollaborativeAmerica’s Tomorrow spoke with Warren about getting public buy-in for her initiatives, activating commercial corridors, and more.

Q: What are some of your goals for the co-op initiative?

A: Last year, the Democracy Collaborative came in and asked our anchor institutions questions like, “What are you outsourcing?” and “What types of businesses would you want to develop as a co-op?” The next phase will be to really drill down and decide what businesses we want to create. We’d like to replicate the success of Evergreen Cooperatives in Cleveland, but maybe not target the same types of businesses. For example, we know that the laundry co-op is not going to work in Rochester because we already have a laundry co-op model here. In Buffalo, they have a solar energy cooperative, so we wouldn't want to be in direct competition with one of our sister cities.

Q: Where have you seen the most job growth for low-income residents?

The hospitals. Rochester Regional and University of Rochester are really strong. They have opened up the door to low-income residents. We are starting to see growth in manufacturing as well. We have a program we started calling YAMTEP [Young Adults Manufacturer Training Employment Program] that helps prepare participants for careers in manufacturing. There are 22 people in our second class, and we have businesses that are eager to hire these people once they’re done.

When you look at our most challenged neighborhoods, many of the people who live in them aren’t working. And many of those that do are in service and non-living wage jobs. So we are supporting the movement to raise the minimum wage to $15 an hour as a start. We also want to build worker-driven co-ops within neighborhoods, so people can have places to work close to where they live. We also think about the barriers to owning businesses. Could childcare be a factor? Our work with the Anti-Poverty Initiative empowers our residents to look at what we need to do to build communities and community wealth.

Q: You’ve spoken about public buy-in being challenging in Rochester, because not everyone acknowledges or agrees that poverty is a serious issue. How do you make sure they support your work?

My administration tries to bring these issues to those other folks that generally wouldn’t automatically see them, and to do it in a way that makes it real for them. We work with our business community to ask them, “What do you need to employ Rochester’s low-income residents?” and, “If we give them the skills that you're talking about, will you hire them?” That’s what YAMTEP is about.

This is everybody’s problem. What we are noticing is that poverty is starting to grow in our suburbs as well. And what happens in the city of Rochester affects the surrounding Monroe County, because we are the regional center. We can tell what’s happening by looking at the number of children who have qualified for free and reduced lunches in schools. A lot of times, people don’t want to deal with this until it hits home.

Q: Can you tell me about the plan to activate commercial corridors and make sure communities of color are part of business creation?

On our commercial corridors, often there are only corner stores and many of them don’t have fresh fruits and vegetables and are not providing healthy foods to our community. When we talk to the residents, they want different types of businesses: bakeries, coffee shops, florists. As a city, we want to bring in the types of businesses the neighborhood wants in a way that is beneficial for them — businesses that they will frequent — so that we’re not being part of the problem.

We are looking at how many empty storefronts we have and what types of façade improvements we need to make. We want to know who owns the buildings and whether they are people of color. Do the buildings have some contamination issues that we need to deal with? We’re really working with landowners and building owners to bring these buildings up to a different standard, so different types of businesses will be attracted.

We’re also looking at Kiva and other organizations that do micro-loans, so that we can help people who might have a business idea but have not had the opportunity to open up a business on a commercial corridor yet.

Q: How do you change economic development from within and strategically shift the way that city government does its business?

When I became mayor, I said we could both redevelop our downtown and be supportive to our community development corporations, even though their needs can be completely different. When I look at my budget, I'm looking at how I can help children and families. In the beginning, our investment goals were our recreation centers, our libraries, and our neighborhoods. Of course, you have to provide essential services, like police and fire, but there is also discretionary money I can use to provide for our most challenged areas to uplift them.

One of the things that our former mayor was doing was focusing on a residential real estate investment strategy — trying to improve the housing stock in neighborhoods and giving support to landlords and homeowners to fix up houses. I thought that was a great investment, but my focus is more on investing in people. As I start to look at my budget, that’s the question I asked myself: “How are we investing in people so that they can be a part of the economic recovery of our city?” 

In New Fellowship, Peer Cities Grow Equitable Economic Opportunities Together

“We do not want to neglect or ignore our underserved population,” said Gwendolyn Tillotson, deputy director of the Department of Economic Development in Houston, Texas. “Rather, Mayor Sylvester Turner and his new administration have made it very clear that it is important for us to be smart and equitable in how we use our resources — to ensure that every community has an opportunity to have access to a good education, to good work opportunities, and to build wealth.”

Last week, Tillotson and two other representatives from Houston traveled to Portland, Oregon, to attend the opening retreat of the Equitable Economic Development Fellowship, a two-year, $1 million effort from the National League of Cities (NLC), PolicyLink, and the Urban Land Institute (ULI) to help equity, transparency, sustainability, and community engagement become driving forces in local economic development efforts. Six cities were chosen to participate in the inaugural year of the fellowship: Boston, Charlotte, Houston, Memphis, Milwaukee, and Minneapolis. 

While in Portland, each city team identified particular equity challenges to focus on during the course of the fellowship. Tillotson said that Houston is looking to prioritize social and economic equity in the implementation of the economic development components of Plan Houston, the city’s first-ever general plan. And in 2010, the city began proactively using the Department of Economic Development as a resource for the private sector and the city’s smaller communities.

“Historically, many communities have not seen the benefits of local government economic development policies and programs,” said Jess Zimbabwe, director of the Daniel Rose Center for Public Leadership in Land Use at NLC and ULI. “It isn’t difficult to find examples in cities and states around the country where local governments have particularly shortchanged people of color, immigrants, and low-income neighborhoods.”

During the fellowship, cities will receive support, leadership development, and technical assistance from NLC, PolicyLink, and ULI — in addition to peer-learning opportunities — to address diversity and inclusion challenges. Another class of six cities will be invited to participate in the second year of the program in 2017.

“The fellowship is a real opportunity to learn from equity experts and our peer cities,” said Martha Brown, deputy commissioner of the Department of City Development in Milwaukee, Wisconsin. The city owns a large portfolio of distressed commercial buildings in neighborhoods with few employment and small-business opportunities. The city is looking to position that inventory to maximize opportunity for start-up small developers and entrepreneurs. “With the help of staff from NLC, PolicyLink, and ULI, we hope to create a model for ownership, renovation, and management of these buildings, and develop a pipeline of entrepreneur tenants,” added Brown.

“We see the equitable economic development fellowship as an opportunity to evaluate and improve practices,” she continued, “so city government plays a positive role in growing prosperity among all its residents.”

“Cities are recognizing that creating equitable and sustainable economic prosperity for all should be the goal of their activities across the board,” said Angela Glover Blackwell, PolicyLink president and CEO. "We are excited to be working with economic development leaders who are eager to integrate an equity approach into their efforts to grow strong local economies."

National Equity Atlas: June Update

Over the past several weeks, we've been analyzing our new ancestry data and also just added two new indicators on poverty and working poverty.
 
Analyzing Ancestry Data 

We recently completed a series of analyses of last month’s racial subgroup data update. Our analysis of homeownership among the Asian and Pacific Islander (API) population found that rates of homeownership range from 25 percent for Samoans up to 68 percent for Taiwanese. Looking at educational attainment and youth disconnectedness among the API population we saw that Southeast Asian and Pacific Islander groups fare much worse than their South and East Asian counterparts. Examining wage disparities within the Latino population, we found that Central Americans tend to earn the least. And our review of unemployment in the Black population shows how certain Sub-Saharan Africans, many of whom are immigrants, have unemployment rates more comparable to the national average. Check out the Data in Action section of the Atlas website to stay up to date on analyses released throughout the month.

New Poverty and Working Poor Indicators

High rates of poverty impact everyone, costing our economy billions of dollars annually and weakening the middle class and democracy. And as the low-wage sector has grown, the share of adults who are working full-time jobs but still cannot make ends meet has increased, particularly among Latinos and other workers of color. The Atlas now includes indicators for the percentage of individuals living below three poverty thresholds (100, 150, and 200 percent of the federal poverty line) and by age so you can understand child poverty, as well as the percentage of full-time workers living below each of the three thresholds
 
Webinars

Join the National Equity Atlas team for a live demo of our new Poverty and Working Poor equity indicators on July 12, 12:00 – 12:30 pm PT / 3:00 – 3:30 pm ET. During this 30-minute webinar, we will walk you through these indicators and policy strategies to advance racial economic inclusion and equitable growth in your community. Register here. Video from the June 22 live demonstration of the Atlas, sponsored by the W.K. Kellogg Foundation, can be viewed here

National Equity Atlas in Measure Up

The Build Healthy Places Network — which connects leaders and practitioners across the health and community development sectors—has just added the National Equity Atlas to its microsite of resources and tools, MeasureUp. You can find the National Equity Atlas on their Mapping Tools page.
 
Thank you!
The Equity Atlas team at PolicyLink and the USC Program for Environmental and Regional Equity (PERE)

Pages