Fairfax County Reaffirms Equity with a Resolution for “One Fairfax”

For many years, officials, advocates, and agency staff in Fairfax County, Virginia, have been concerned with the inequities affecting low-income residents and people of color in the county — and in its 2015 Strategic Plan to Facilitate Economic Success the County Board of Supervisors acknowledged the central importance of equity as a driver of regional economic growth and vitality. But they needed deeper, cross-sectoral data to help underscore their day-to-day experiences and to point the way toward actionable policy solutions.

With just over a million residents, Fairfax County has seen a surge of growth, primarily driven by people of color.  Between 2000 and 2010, the population of the county grew 11 percent, while there was a 42 percent increase of people of color in the county.

"Fairfax is generally a suburban community known typically to be affluent so these issues are sometimes masked in our general data," said Karla Bruce, deputy director of the Fairfax County Department of Neighborhood and Community Services.

In 2015, county officials and local community leaders partnered with PolicyLink and the University of Southern California's Program for Environmental and Regional Equity (PERE) to release an Equitable Growth Profile for Fairfax County, Virginia. The disaggregated data reported in the profile brought Fairfax County's racial inequities into clear focus, and catalyzed a local coalition into action. By supporting the development of the profile, Fairfax leadership demonstrated its commitment to equity and a vision of "One Fairfax" — a community in which all can participate and prosper.

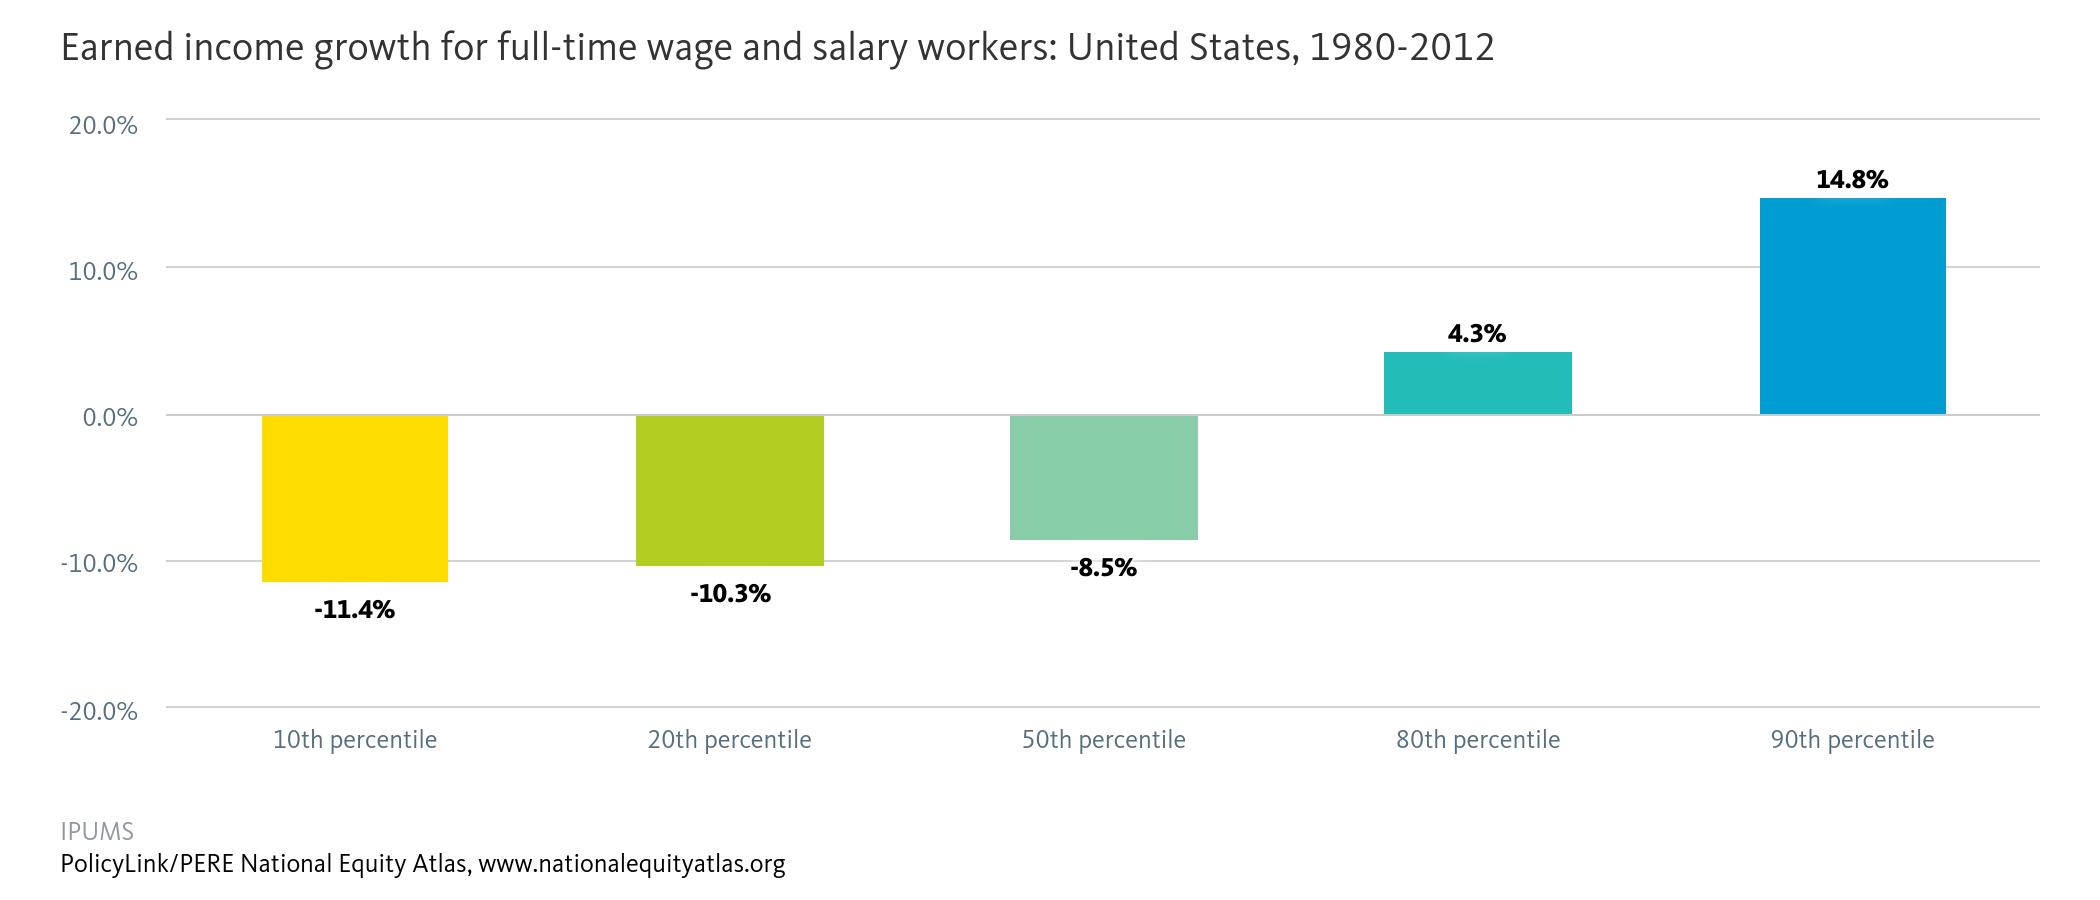
As the profile pointed out, Fairfax County ranks second nationally in terms of household income, with a median of $110,292. At the same time, the middle class is shrinking: workers in the bottom 20 percent saw their wages stagnate between 1979 and 2012, while workers in the highest 20 percent have seen above-national-average wage increases. More than 10 percent of Latinos and Blacks lived in poverty in 2012 compared to less than 3 percent of Whites.

"I think the Equitable Growth Profile affirmed some things that many folks had been talking about anecdotally in terms of demographic shifts, population needs, and concerns that a number of people were having," said Patricia Mathews, president and CEO of the Northern Virginia Health Foundation. "I think it wasn't so much a new statement, but rather it allowed people to say, 'Now we have data. Now we can think about this a lot more strategically.'" Community leaders like Mathews were engaged in the process of producing the profile and in discussions about its findings. The county has been guided by a collective impact framework to advance equity, characterized by its "respect for and integration of the wisdom, voice, experience, and leadership of community residents."

"We need to understand and improve our work"

This summer, Fairfax County rededicated itself to equity by passing the One Fairfax Resolution, a formal declaration of commitment to racial and social equity passed by both the County Board of Supervisors and the Fairfax County School Board. The resolution will direct the development of a One Fairfax policy, which the boards hope to adopt as early as next summer.

The resolution formalizes the county's definition of racial and social equity and acknowledges the importance of equity to fostering greater opportunities and inclusive growth: "to truly create opportunity, we need to understand and improve our work through a racial and social equity lens from the very core of the organization outward, focusing intentionally and deliberately towards sustainable structural changes."

Over the last several years, Fairfax County has undertaken several initiatives to address racial and social disparities in a variety of areas, including juvenile justice, education, employment, health, and child welfare. Prior to the publication of the Equitable Growth profile, a 2012 study from the Center for the Study of Social Policy encouraged government leaders to scrutinize the pathways and institutions — including the police and school systems — that caused Black and Latino youth to be disproportionately represented in the juvenile justice system. They created an interagency team to go through the analysis and drill into what could be done to address disparities. They also joined the Government Alliance on Race and Equity (GARE).

Karen Shaban, strategic project manager of Fairfax County government, said that all of these efforts helped officials to realize that sustainable change goes beyond human services and moved them to look at other parts of their system, such as zoning policies, transportation, and land use. "All of these efforts set the stage for us to formally say there needs to be more intentionality to make sure that Fairfax County's institutions and systems are not contributing to the disparities that exist."

Currently, the County is using the equity concepts of the new One Fairfax resolution to guide planning related to a number of strategic initiatives in the areas of early childhood education, community development, and recreation.  "These are ripe opportunities to bring an equity lens to the work," said Shaban. The lens can help guide future redevelopment projects like the planning for a 10-acre campus of a former high school. 

Experimenting with "equity-in-practice" — particularly expanding community engagement beyond common public meetings — will give county staff an opportunity to try out some tools and processes to see what works best as they continue to develop the equity policy mandated by the One Fairfax resolution.

"I think we have a really progressive government in Fairfax County," said Karen Cleveland, president and CEO of Leadership Fairfax, a community leadership development organization. "But when you work for the government, you can very easily get drawn into policy development and policy implementation. What this One Fairfax resolution does is lift the work above that. It says, 'This is going to be our umbrella.'"

Leadership Fairfax, the Northern Virginia Health Foundation, and other organizations are working as thought partners with county staff to make sure that community needs are consistently prioritized — and not just from a government services perspective.


"It's helped us to not only have a common agenda but also to really commit to outcomes," added Bruce, "so that we can shift the possibility for progress and share in the responsibility for change. We haven't reached our destination, but there is definitely power in the networks that we are creating. I am hopeful that we will be able to realize this vision of One Fairfax."

Check out the rest of the September 27, 2016 America's Tomorrow: Equity is the Superior Growth Model issue.

September National Equity Atlas Update

The Atlas is announcing the beta version of a new feature that highlights the equity movement on-the-ground:
 
Preview neighborhood-level mapping added to the Atlas
Today, we released the beta version of new interactive neighborhood-level mapping on the Atlas. These new maps allow users to understand how selected indicators (e.g., unemployment) vary across neighborhoods within a city or region, and can help inform targeted employment and workforce development initiatives as well as infrastructure investments. This beta release features county and census-tract level maps of the unemployment indicator. Register for our special preview of the maps on October 6 specifically for Atlas subscribers and share your feedback ahead of the public release next month.
 
Welcoming America webinar
Welcoming America helps communities across the country achieve prosperity by becoming more welcoming toward immigrants and all residents. On October 7 the National Equity Atlas will be featured in a webinar on eelcoming and economic development. Participants will examine selected economic indicators on the Atlas to get a sense of how immigrants are faring in their communities. Angel Ross, Research Associate at PolicyLink and Justin Scoggins, Data Manager at the USC Program for Environmental and Regional Equity (PERE) are featured speakers. Register here.
 
Forward Community Investments webinar
Last week, the National Equity Atlas kicked off the Forward Community Investments 2016-2017 Racial Equity Webinar Series. The goal of this series is to provide FCI partners with tools and approaches that can be used to advance social, racial, and economic equity and inclusion within their work. The webinar provided an overview of the Atlas framework and a walk through of the Atlas, focusing specifically on Wisconsin.

New Report Makes Case for Equity in Metro Atlanta
A new report from the Partnership for Southern Equity (PSE), Growing the Future: The Case for Economic Inclusion in Metro Atlanta, describes how equity is both a moral and economic imperative for the Atlanta region and for the nation as a whole. The report highlights our full employment analysis and GDP with racial equity analysis, both of which underscore how eliminating racial inequities results in “equity dividends” for the broader economy. See our short post about the report here.

New “Chart of the Week” series
We've launched a new "Chart of the Week" series to add equity data about growth and prosperity to the national dialogue. Every week, we post a new chart drawing from the Equity Atlas related to current events and issues. Our inaugural post lifted up #BlackWomensEqualPay and looked at median wages for Black women in Atlanta, Georgia. We also shared charts highlighting the #Fightfor15, #NoDAPL, and the most recent Census report. Follow our posts on social media using #equitydata, #Fightfor15, and #NoDAPL and in our Data in Action section.

Foundations to Reinvest in One of Nation’s Strongest Networks of Support for Entrepreneurs

The New Economy Initiative (NEI), an entrepreneurial infrastructure building initiative for Detroit and Southeast Michigan, has granted a total of $96.2 million to organizations and programs supporting entrepreneurs since it launched in 2007.

According to analysis conducted by PricewaterhouseCoopers LLP (PwC) and the W.E. Upjohn Institute for Employment Research, NEI’s support has helped entrepreneurs and small businesses generate $2.9 billion in real economic output and create 17,490 jobs in southeast Michigan.

“Detroit’s evolution from recovering region to thriving economy demands more than just creating new businesses or restoring buildings. NEI is proving that intentional focus on equity and inclusion is driving Detroit’s ‘new economy.’” Angela Glover Blackwell, Founder and President, PolicyLink

NEI has achieved this impact by making grants to organizations and programs supporting entrepreneurs of all kinds, from grass roots to high growth, creating a vast network of entrepreneurial support in southeast Michigan. The economic and employment impact reports by PwC and Upjohn Institute analyzed years of information reported to NEI by grantees via quarterly reports, as well as interviews with regional entrepreneurs.

Findings include:

  • 4,400 companies directly serviced by NEI grantees through 2015
  • 179,571 attendees of events in metro Detroit’s entrepreneurial network
  • More than 1 million square feet of entrepreneurial space activated
  • $232 million in additional program dollars matched by NEI grantees
  • $1.9 billion in real gross domestic product generated by NEI-supported companies
  • $2.9 billion in real output generated by NEI-supported companies
  • 17,490 jobs created by NEI-supported companies, 70% of which are located in Wayne County.


For more information, read the full press release from NEI and download the full report.

All-In Cities: Building Momentum in Pittsburgh, New Orleans, Detroit, and Indianapolis


As America’s cities experience a comeback, city leaders need to implement bold strategies to ensure no one is left behind or displaced. All should have the opportunity to contribute to building new urban economies that are equitable, sustainable, and prosperous. Through the All-In Cities initiative, PolicyLink empowers city officials, community advocates, and other civic leaders with the policy ideas, data, and hands-on assistance to make racial economic inclusion and equitable growth their reality. We’ve had an exciting week full of milestones:

Pittsburgh: Equitable Development

Today, more than one hundred community leaders gathered at the August Wilson Center in Pittsburgh for the release of Equitable Development: The Path to an All-In Pittsburgh, produced in partnership with Neighborhood Allies and Urban Innovation21. Mayor William Peduto, City Council Member Daniel Lavelle, and other leaders from government, business, and the nonprofit sector discussed the recommendations. Follow the conversation on social media at #AllInPittsburgh

Indianapolis: Equitable Innovation Economies

Since 2014, New York, Indianapolis, Portland and San Jose have been piloting new approaches to advancing equity in innovation and manufacturing through the Equitable Innovation Economies Initiative, a multi-year project led by the Pratt Center for Community Development in collaboration with PolicyLink and the Urban Manufacturing Alliance (UMA). Yesterday at the UMA national convening in Indianapolis, we released a new report, Prototyping Equity: Local strategies for a more inclusive innovation economydocumenting the groundbreaking efforts of these cities. Join the conversation at #proequity.

New Orleans: #EquityNewOrleans

PolicyLink is advising the city of New Orleans in the development of its citywide equity strategy. On Tuesday, September 13, the city held its second community listening session to discuss how the city can integrate racial equity throughout its activities. Learn about the initiative at www.equityneworleans.org and participate at #EquityNewOrleans
 

Detroit: New Economy Initiative Impact 

On Wednesday, September 14, the New Economy Initiative released a report highlighting its impact. Since 2007, the unique funder collaborative has helped build an inclusive entrepreneurial ecosystem in Detroit, providing direct support to over 4,400 companies, helping launch more than 1,600 new companies (39 percent of them owned by people of color and 32 percent by women), and creating more than 17,000 jobs. PolicyLink has advised the initiative on its equity strategy since 2009.

Learn more about our All-In Cities initiative and sign up for updates at www.allincities.org.


New Report Sets Equitable Development Agenda for Pittsburgh

Pittsburgh is a city on the rise, yet too many residents remain cut off from opportunity by poverty, structural racism, and discrimination. Local leaders must implement a targeted, intentional strategy for equitable development to ensure all can thrive in the new Pittsburgh. PolicyLink, Neighborhood Allies, and Urban Innovation21 convened dozens of Pittsburgh community leaders to create a shared definition of equitable development and craft an agenda to make it the reality. Equitable Development: The Path to an All-In Pittsburgh presents a roadmap to put all of the region’s residents on track to reaching their potential. Through the All-In Cities initiative, PolicyLink equips city leaders with policy ideas, data, and strategies to advance racial economic inclusion and equitable growth.

“Pittsburgh is the perfect place to start an All-In Cities initiative,” said Angela Glover Blackwell, PolicyLink president and CEO. “As the city successfully transforms its economy and sees a wave of new development, an equitable development strategy is essential to ensure that all neighborhoods and residents, including those of color, participate and benefit. Achieving full inclusion will lead to sustainable and shared prosperity.”

This report outlines a five-point agenda for equitable development:

  1. Raise the bar for new development — Growth must happen in a way that benefits and does not displace longtime lower-income residents and neighborhood entrepreneurs.
     
  2. Make all neighborhoods healthy communities of opportunity — The region needs a comprehensive strategy to increase housing affordability and stability and to unlock opportunity in its highest poverty neighborhoods.
     
  3. Expand employment and ownership opportunities — Connecting lower-wealth residents to good, family-sustaining jobs and asset-building opportunities is critical to ensuring they participate in and contribute to the region’s resurgence.
     
  4. Embed racial equity throughout Pittsburgh’s institutions and businesses — To eliminate wide racial inequities and uproot bias, the region’s institutions, organizations, and businesses need to adopt racial equity-focused approaches.
     
  5. Build community power, voice, and capacity — High-capacity community-rooted organizations and multiracial, multisector coalitions are essential to advancing equitable development policies and practices over the long term.


To learn more, download the full report.

Prototyping Equity: Local Strategies for a More Inclusive Innovation Economy

Since 2014, a visionary group of leaders from New York, NY, Indianapolis, IN, Portland, OR and San Jose, CA have been piloting new approaches to advancing equity in innovation and manufacturing through the Equitable Innovation Economies (EIE) initiative. Over two years, each city in this community of practice has evaluated a particular economic development project through an equity lens, working to increase benefits for all city residents and communities.
 
EIE’s flagship report, Prototyping Equity: Local strategies for a more inclusive innovation economy documents this work, including the tools guiding this pilot effort, candid perspectives from each city, and broader insights for the field. The Pratt Center for Community Development in Brooklyn, NY, and PolicyLink in Oakland, CA are leading this effort, providing technical assistance and facilitation. The Urban Manufacturing Alliance’s (UMA) expansive network of over 100 cities has served as a platform for this initiative, and the report will be shared with members at the UMA 2016 National Convening in Indianapolis on September 14-16.
 
Read more about this effort and download the full report and follow the event conversation on twitter at #proequity.

Chart of the Week: Why the Latest U.S. Census Report Matters

To add equity data to the national dialogue about growth and prosperity, every week the National Equity Atlas team posts a new chart from the Equity Atlas related to current events and issues.

Yesterday, the Census Bureau released a report on 2015 income and poverty data, announcing that median household income increased by over 5 percent—the fastest growth on record. As President Obama described in a Facebook post and video with Jason Furman, Chairman of the Council of Economic Advisers, the gains were largest among the bottom fifth of households.

To highlight why this gain — especially among the bottom quintile of earners — is so important, this week’s chart looks at real earned income growth for full-time wage and salary workers in the United States from 1980 to 2012.

Over the three decades from 1980 to 2012, the inflation-adjusted earnings of the bottom 10 percent of workers decreased the most at more than 11 percent. In fact, the whole bottom half of workers experienced real declines in their incomes over this period. At the other end, those in the top 10 percent saw their earnings increase by nearly 15 percent. The announcement that real income growth in 2015 was the fastest since 1969 for households at the 10th, 20th, 40th, 50th, and 60th percentiles is a promising finding, though there is still more to be done.

These income increases, combined with refundable tax credits, lifted millions of families and children out of poverty. In 2015, 9.2 million Americans, including 4.8 million children, moved above the poverty line with the help of credits like the Earned Income Tax Credit (EITC) and the Child Tax Credit (CTC). Expanding these social safety net programs through a more equitable tax code and advancing pre-tax income strategies like minimum wage increases and stronger collective bargaining rights are key to supporting the more than 8 million families still in poverty. For more information on policies that contribute to wage growth, see the Economic Policy Institute’s Agenda to Raise America’s Pay.

To view the distribution of income growth in your community over the last three decades, visit the National Equity Atlas and type in your city, region, or state. Download the charts and share them on social media using #equitydata.

Chart of the Week: Why the Latest U.S. Census Report Matters

To add equity data to the national dialogue about growth and prosperity, every week the National Equity Atlas posts a new chart related to current events and issues.

Yesterday, the Census Bureau released a report on 2015 income and poverty data, announcing that median household income increased by over 5 percent—the fastest growth on record. As President Obama described in a Facebook post and video with Jason Furman, Chairman of the Council of Economic Advisers, the gains were largest among the bottom fifth of households.

To highlight why this gain — especially among the bottom quintile of earners — is so important, this week’s chart looks at real earned income growth for full-time wage and salary workers in the United States from 1980 to 2012.


Over the three decades from 1980 to 2012, the inflation-adjusted earnings of the bottom 10 percent of workers decreased the most at more than 11 percent. In fact, the whole bottom half of workers experienced real declines in their incomes over this period. At the other end, those in the top 10 percent saw their earnings increase by nearly 15 percent. The announcement that real income growth in 2015 was the fastest since 1969 for households at the 10th, 20th, 40th, 50th, and 60th percentiles is a promising finding, though there is still more to be done.

These income increases, combined with refundable tax credits, lifted millions of families and children out of poverty. In 2015, 9.2 million Americans, including 4.8 million children, moved above the poverty line with the help of credits like the Earned Income Tax Credit (EITC) and the Child Tax Credit (CTC). Expanding these social safety net programs through a more equitable tax code and advancing pre-tax income strategies like minimum wage increases and stronger collective bargaining rights are key to supporting the more than 8 million families still in poverty. For more information on policies that contribute to wage growth, see the Economic Policy Institute’s Agenda to Raise America’s Pay.

To view the distribution of income growth in your community over the last three decades, visit the National Equity Atlas and type in your city, region, or state. Download the charts and share them on social media using #equitydata.

Investing in Second Chances for Formerly Incarcerated People: An Interview with Department of Justice Fellow Daryl Atkinson

Sixteen years ago, Daryl Atkinson was like many of the 600,000 Americans leaving prison each year — excited to return home, but worried about the welcome he might receive as a formerly incarcerated person. Though his family refused to define him solely by his past mistakes and supported him as he pursued college and law school, society was another story. Not only did he face social stigma because of his past, he lost his driver’s license, making it difficult to find work; was barred from receiving federal financial aid for college; and, perhaps most importantly, is still denied the right to vote in his home state of Alabama.

It is this type of structural and cultural discrimination — the many ways that society forces those with a criminal record to continue to “serve time” even after they are released — that Atkinson now fights as the inaugural Second Chance Fellow at the U.S. Department of Justice (DOJ). Prior to this appointment, Atkinson was recognized as a White House “Reentry and Employment Champion of Change” for his work as a senior staff attorney at the Southern Coalition for Social Justice, where he advocated for the rights and needs of people with criminal records. America’s Tomorrow spoke with Atkinson about his many years working to shift the narrative about those who have been incarcerated, connecting them with the support, respect, and opportunity necessary for them to thrive.

You are the first Second Chance fellow at the DOJ, and you are a founding member of the North Carolina Second Chance Alliance. Can you explain what a “second chance culture” entails?

I often relate it to my personal experience after prison. I served 40 months in prison, much of it in a maximum security institution when I was in my twenties, and when my mom and my stepdad came to pick me up, they rented a Lincoln Town Car. I didn’t pay any particular attention at that time because I was so excited to get away from that place, but a couple of years later I asked my stepdad why. He said they wanted to make a grand gesture to send the message that my experience in prison didn’t completely define who I was and what I could be. They continued to support me — offering food and shelter and financial support — throughout college, and the combination of support and physical investment is a large part of what I view as a “second chance” approach. We need to invest in people’s success, so that they can be contributors to their community and society.

The Obama Administration has been instituting a number of policy solutions to cultivate this concept. The Second Chance Act, signed into law at the end of the Bush Administration, has resulted in more than 700 grants totaling over $400 million to reduce recidivism and improve outcomes for people returning from state and federal prisons, local jails, and juvenile facilities. These investments help people with criminal records by providing basic needs like housing assistance, job training, and substance abuse treatment. More recently, the Department of Education started the Second Chance Pell Program, which will allow over 12,000 eligible incarcerated students to pursue postsecondary education while in prison. These kinds of programs aren’t enough to meet the needs of the entire formerly incarcerated population, but they are helping the Administration build the evidence base for how powerful these programs are, which will aid in advocating for more funding for this work.

When you were at the Southern Coalition for Social Justice, you helped to pass a “ban the box” policy in Durham, North Carolina, that had incredible results. Can you describe how that campaign developed?

The Southern Coalition for Social Justice (SCSJ) is a civil rights advocacy organization that follows a community-lawyering model, meaning that we provide general counsel for the most vulnerable communities across the southeast, and we let them set the agenda of what issues are most important. Engaging the community around these issues is something that has guided my work at SCSJ and informs my work at DOJ. For instance, a few years back we were working on voting rights for those with criminal records in North Carolina, but when we engaged the community we realized that barriers to employment were the most pressing need. We were aware of the “ban the box” movement that had started in Oakland, California, and started a similar campaign in Durham, North Carolina, to remove criminal history questions from job applications and prohibit the use of a criminal record as an automatic bar to employment.

We knew that to successfully shift the narrative around employing formerly incarcerated people, we needed to ensure that people with criminal records were integrated into the policy-making process throughout. When there were city council meetings, we engaged with community partners to train local spokespeople who could speak in their own voice about the impact of not being able to work and how that affected their families. We reached out to faith-based organizations to put a moral force behind our campaign. We got some notable endorsements from the sheriff about how ban the box was consistent with public safety, because keeping people with criminal records from employment opportunities can force them back into an underground economy.

We also made the economic argument, pointing out that there are 1.6 million adults with criminal records who shouldn’t be sitting on the sidelines of the economy. By sharing these messages and engaging community members to tell their stories, we were able to convince the city and the county governments to pass ban the box policies that have had a huge effect. In the city of Durham, for example, the total percentage of city hires of people with criminal records was 2 percent in 2011, the year the policy passed; by 2014 it was over 15 percent — a greater than seven-fold increase.

How does the work you’re undertaking at the DOJ continue this work and connect to your larger goals of building a second chance culture?

In my fellowship at the DOJ’s Bureau of Justice Assistance (BJA), I advocate for the rights and needs of those with criminal history, and I also work to ensure that DOJ is hearing from the stakeholders most directly affected by the justice system. This part of my work draws heavily on the lessons I’ve learned at the local level. Having this bridge between the policymakers and those most affected by the policy is a game-changer. Not only does it provide important feedback on the effects of policy, it also helps change the temperature of the exchanges between communities and the federal government. When policymakers have real exchanges with folks from the community, and hear about their family obligations and experiences — like dropping their kids off at daycare — it diminishes the “us versus them” dynamic that can make it easier to enact negative public policies. In general, I think we need more open dialogue about how common interactions with the justice system are, and how it is not just some fringe part of society that deals with these issues.

Ten to 12 million people in the U.S. cycle in and out of city and county jails, and one in three Americans have an arrest or conviction history. This is a huge segment of our adult population, and to continue to marginalize them through stigma and discriminatory policies has significant consequences for our society as a whole. That is why part of my fellowship includes qualitative interviews with formerly incarcerated people who have gone on to become highly successful. I want to identify which interventions changed the trajectory of their lives, and lift up these successes to the federal government for future policymaking. I am also going to create a digital story bank of their stories, so that the public can access these stories and see that people who have been in prison can go on to be active, positive, influential members of their community. Both the public and policymakers need to hear these stories and realize not only the hunger for opportunity that people who are leaving prison have, but the potential they have to go on to great things. 

Oakland’s Displacement Crisis: As Told by the Numbers

Oakland stands at the center of a perfect storm. The city and surrounding Bay Area region are experiencing extraordinary economic growth, but housing production is not keeping pace with the escalated demands, nor is sufficient housing affordable to many existing residents and the expanding lower-income workforce.  The current displacement crisis undermines the health and wellbeing of its residents, and threatens the historic diversity that gives Oakland its strength and vitality. 
 
Key Statistics:
  • Nearly half of rental households in Oakland are cost burdened.
  • 63% of African American households are housing cost burdened.
  • Oakland lost 34,000 African American residents – representing a 24% decline, between 2000-2010.
  • In the last year, the median market rent for an available two-bedroom apartment in Oakland has increased by 25%.


Vital community members have been priced out of Oakland. The housing crisis is impacting workers vital to a functioning economy, with little to no options for low and even moderate wage-earners seeking housing on the open market.

 
  • Number of Oakland units affordable for workers earning the City of Oakland’s minimum of $12.55/hour: Zero (Estimated salary of $26,104, $20,282 after taxes = $508/month towards housing).
  • Percentage of income average an Oakland minimum wage worker would have to devote for a 1BR apartment: 112% ($1900 average market rent (Trulia) out of total $1,690 estimated post-tax monthly income).
  • Number of Oakland units affordable for workers with entrance-level teacher salary: Zero (Estimated salary of $42,497 per Oakland Education Association, $31,634 after taxes = $790/month towards housing).
  • Percentage of income average a worker with an entrance-level teacher salary would have to devote for a 1BR apartment: 72% ($1900 average market rent (Trulia) out of total $2,636 estimated post-tax monthly income).
  • Number of Oakland units affordable for workers earning an entrance-level fire fighter salary: Three (Estimated salary of $81,419 per City of Oakland pay schedule for fire fighter, or $53,755 after taxes = $1344/month towards housing).
  • Percentage of income average entry-level fire fighter would have to devote for a 1BR apartment: 42% ($1900 average market rent (Trulia) out of total $4479 estimated post-tax monthly income).
 
To learn more, check out the PolicyLink brief: Oakland's Displacement Crisis: As Told by the Numbers, which highlights some of the challenges Oakland tenants are facing in the ongoing housing crisis, and some key policy steps that could provide much needed relief.

Pages